Fig. 1
Download original image
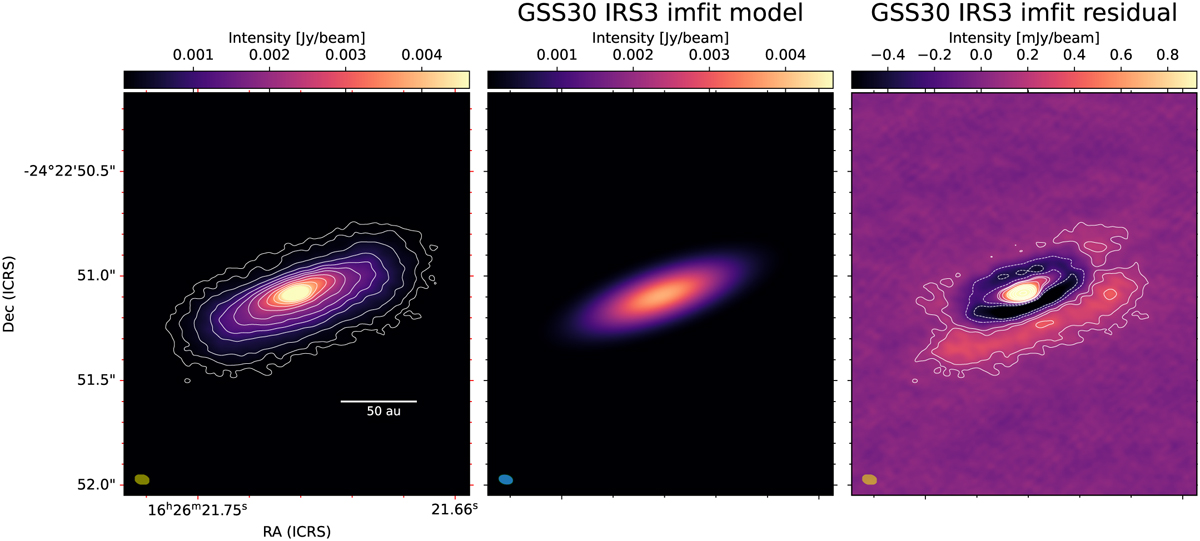
ALMA continuum observations of GSS30 IRS at 1.3 mm. Left: continuum image of GSS30 IRS3. The white contours are 5, 10, 20, 40, 60, 80, 100, 130, 160, 190, and 220 times the rms (1σ = 18.5 µJy beam–1). Center: Model image of the Gaussian fit. Right: residual from the model image of the Gaussian fit. The white contours are –20, –10, 5, 10, 20, 40, 60, 80, 100, 130, 160, 190, and 220 times the rms. The dashed lines represent negative contours. The beam size is represented by the filled ellipse in the bottom left corner of the three images.
Current usage metrics show cumulative count of Article Views (full-text article views including HTML views, PDF and ePub downloads, according to the available data) and Abstracts Views on Vision4Press platform.
Data correspond to usage on the plateform after 2015. The current usage metrics is available 48-96 hours after online publication and is updated daily on week days.
Initial download of the metrics may take a while.