Fig. 5
Download original image
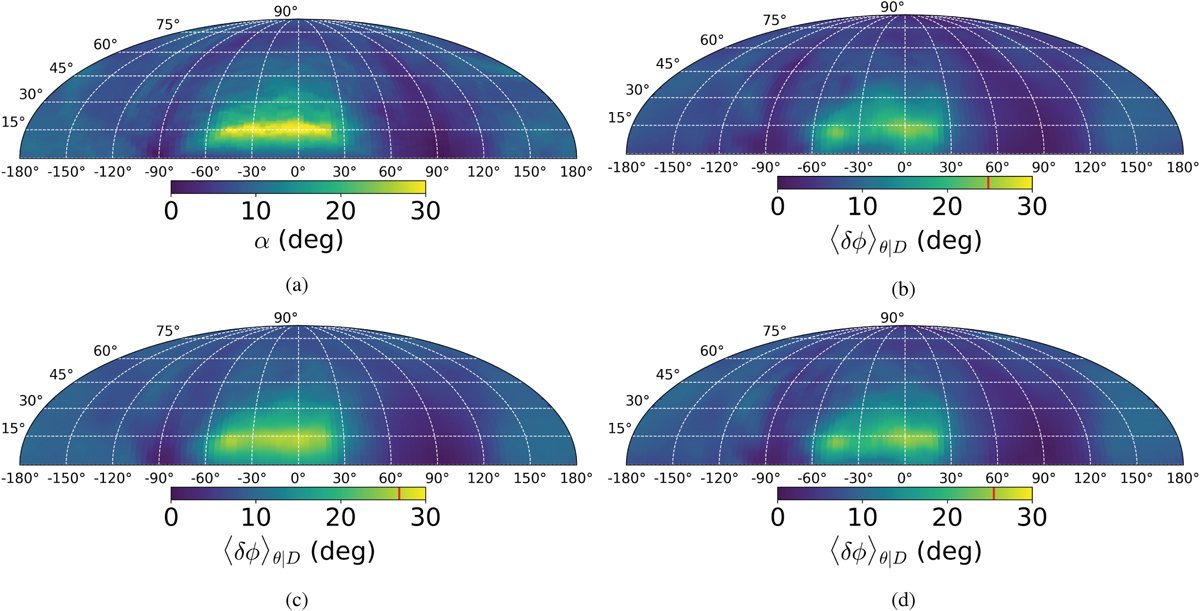
Amount by which a UHECR of rigidity r* = 5 × 10¹⁹ eV is deflected by different GMF configurations for all possible observed arrival directions on the northern sky, θobs (the deflection map; see Fig. 1 for the definition of the relevant quantities). Panel a: true deflection map. Panel b: mean deflection over the posterior samples for scenario A. Panel c: as in 5b, but the local measurements of the GMF now contain information on the LOS component as well as the POS component (scenario B). The additional information in this case causes a greater resemblance of the posterior mean to the true field, and so the deflection map is closer to Fig. 5a. Panel d: as in Fig. 5b, but the posterior is additionally constrained by the integrated data shown in Fig. 6b (scenario C). The scale of the color bar is kept up to 30 degrees to aid visual comparison. The red line on the color bar indicates the maximum deflection for each case. The dominant central feature of Fig. 5a is recovered in Figs. 5b–5d, since it is caused by the largest-scale features of the magnetic field, which we are able to infer in every case.
Current usage metrics show cumulative count of Article Views (full-text article views including HTML views, PDF and ePub downloads, according to the available data) and Abstracts Views on Vision4Press platform.
Data correspond to usage on the plateform after 2015. The current usage metrics is available 48-96 hours after online publication and is updated daily on week days.
Initial download of the metrics may take a while.