Open Access
Fig. 8.
Download original image
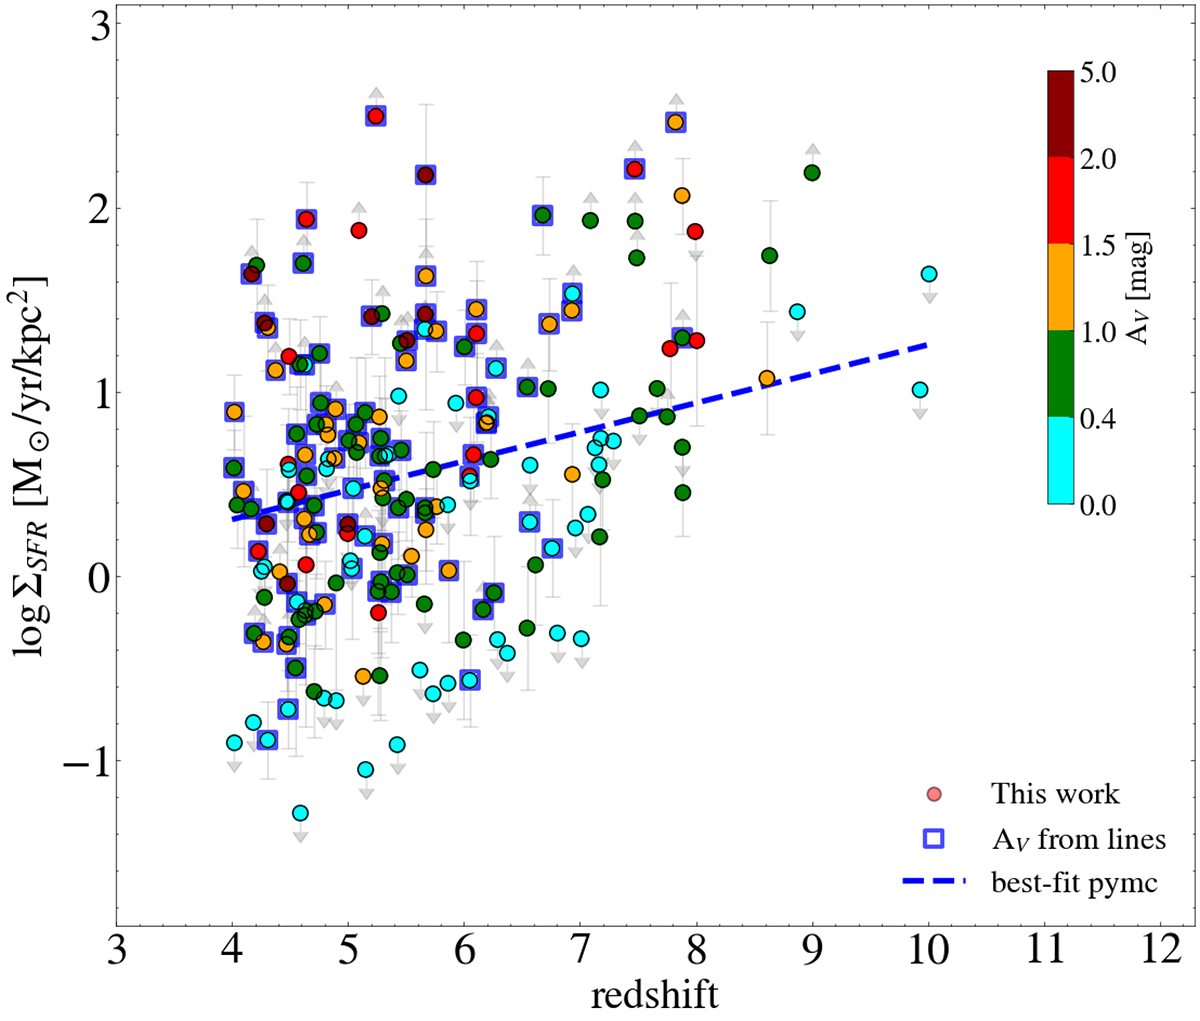
Redshift evolution of ΣSFR (analogous to Fig. 2), color-coded by the attenuation, AV, estimated as described in the text. Galaxies with AV values derived from the emission lines are encapsulated within bigger blue squares.
Current usage metrics show cumulative count of Article Views (full-text article views including HTML views, PDF and ePub downloads, according to the available data) and Abstracts Views on Vision4Press platform.
Data correspond to usage on the plateform after 2015. The current usage metrics is available 48-96 hours after online publication and is updated daily on week days.
Initial download of the metrics may take a while.