Open Access
Fig. 3.
Download original image
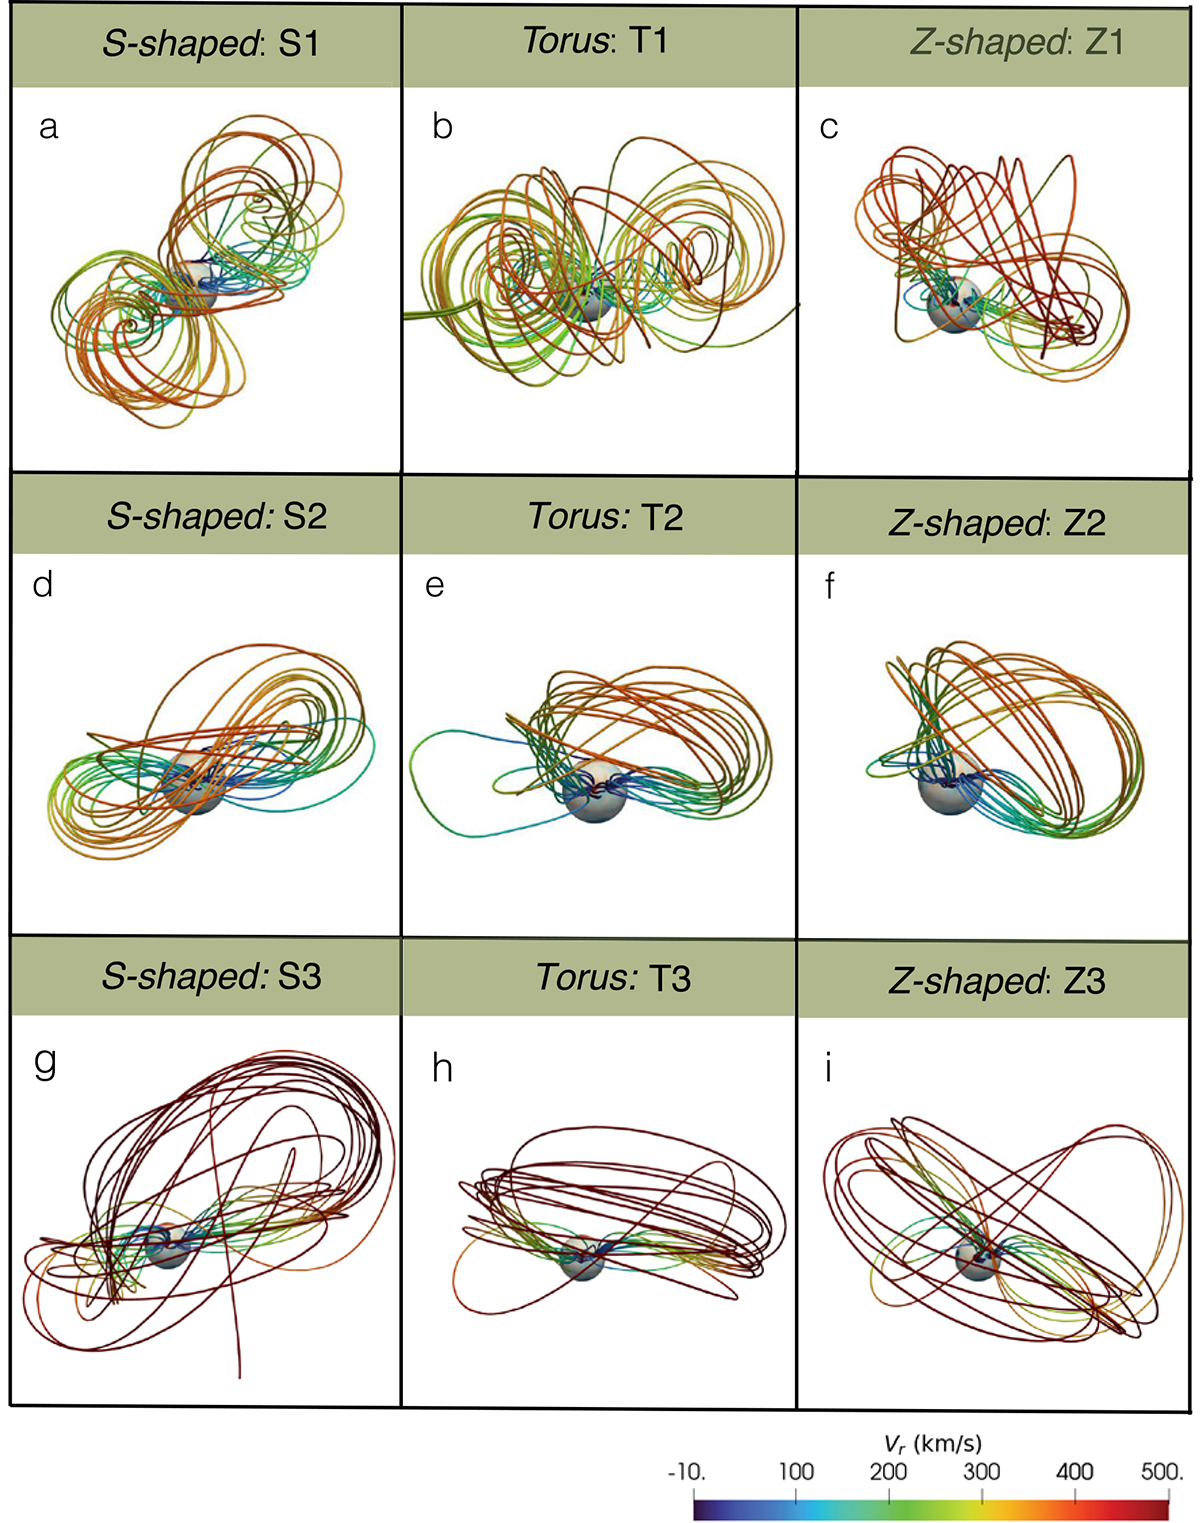
Top views of CME magnetic structures at 3.2 h. The field lines are traced from the locations of the flux-rope footpoints at the beginning. The color represents the radial velocity, which ranges from −10 to 500 km/s.
Current usage metrics show cumulative count of Article Views (full-text article views including HTML views, PDF and ePub downloads, according to the available data) and Abstracts Views on Vision4Press platform.
Data correspond to usage on the plateform after 2015. The current usage metrics is available 48-96 hours after online publication and is updated daily on week days.
Initial download of the metrics may take a while.