Open Access
Fig. 2.
Download original image
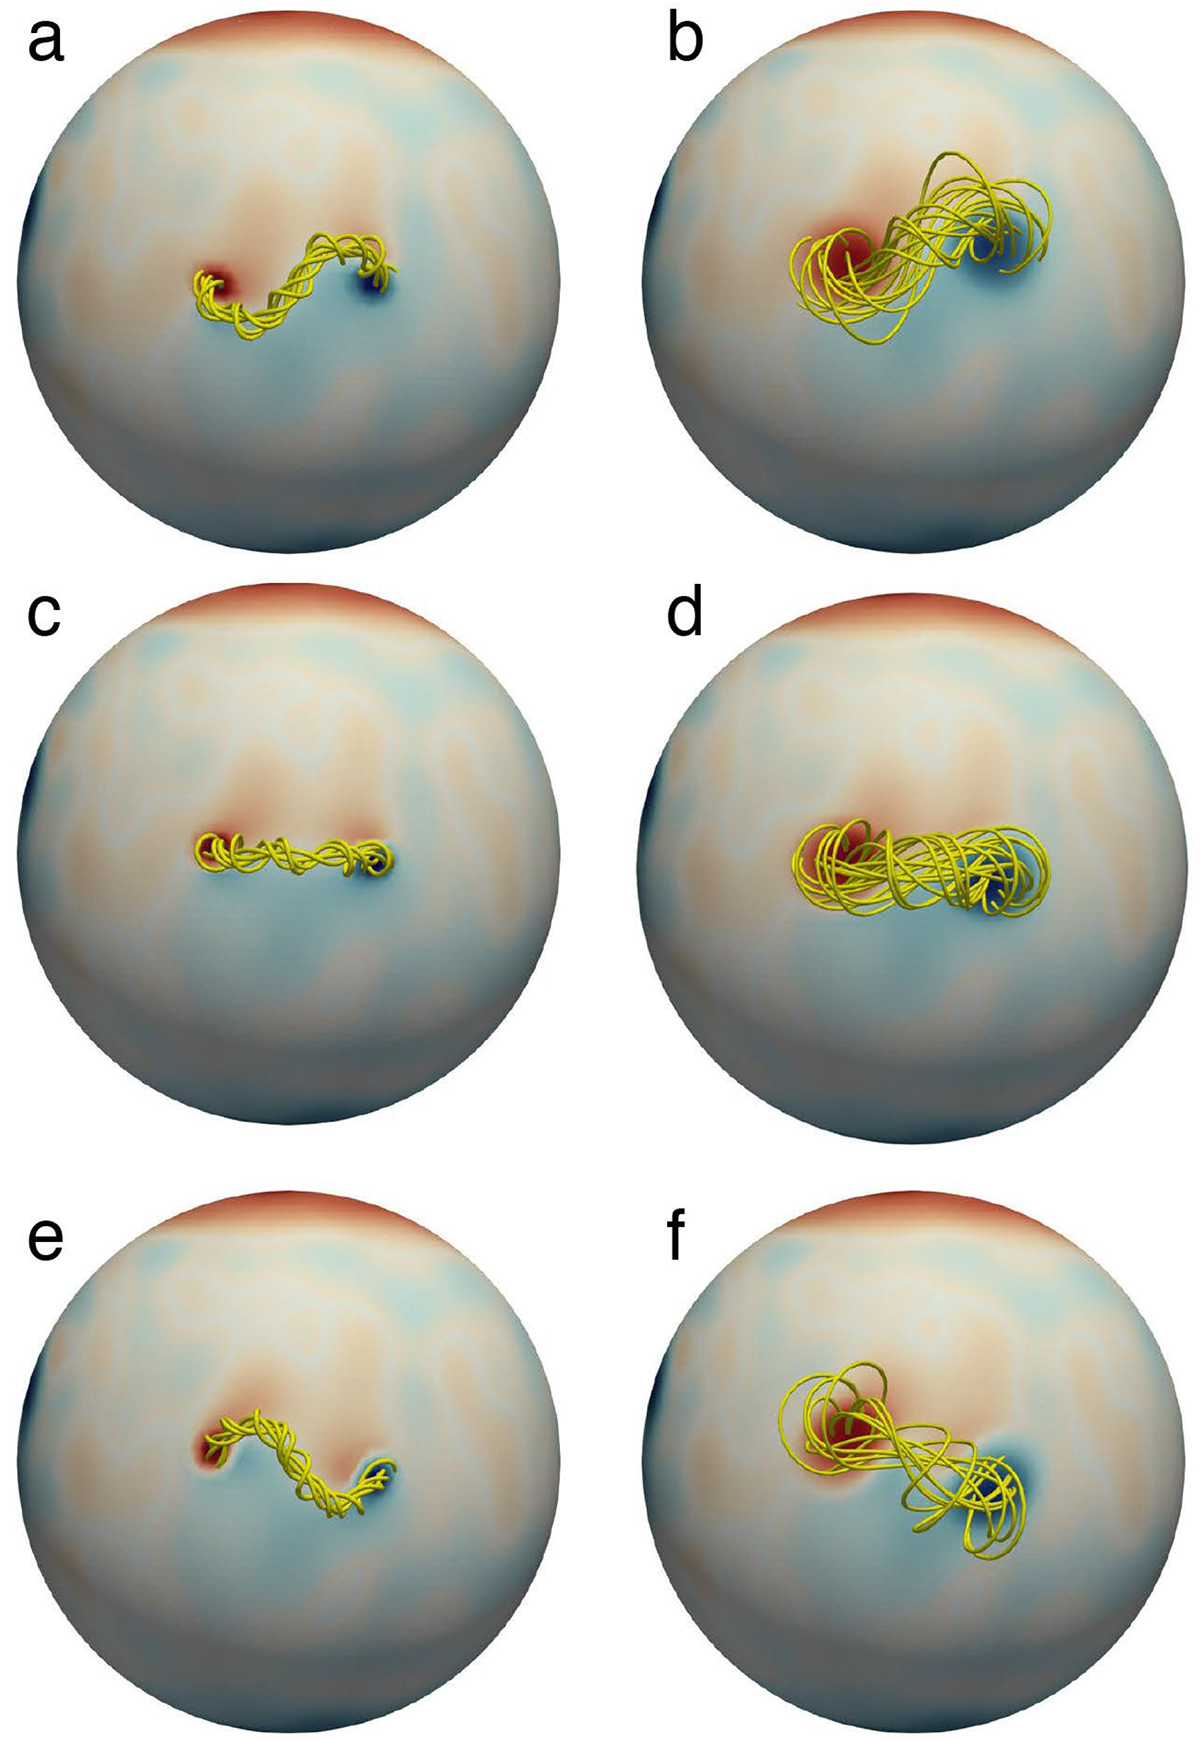
Magnetic structures of flux ropes in typical cases. Panels a–f show the cases of S1, S2, T1, T2, Z1, and Z2, respectively. The yellow lines represent flux ropes, which are traced from the flux rope footpoints. The left and right panels depict flux ropes with the small and large cross-section radius, respectively.
Current usage metrics show cumulative count of Article Views (full-text article views including HTML views, PDF and ePub downloads, according to the available data) and Abstracts Views on Vision4Press platform.
Data correspond to usage on the plateform after 2015. The current usage metrics is available 48-96 hours after online publication and is updated daily on week days.
Initial download of the metrics may take a while.