Fig. 1
Download original image
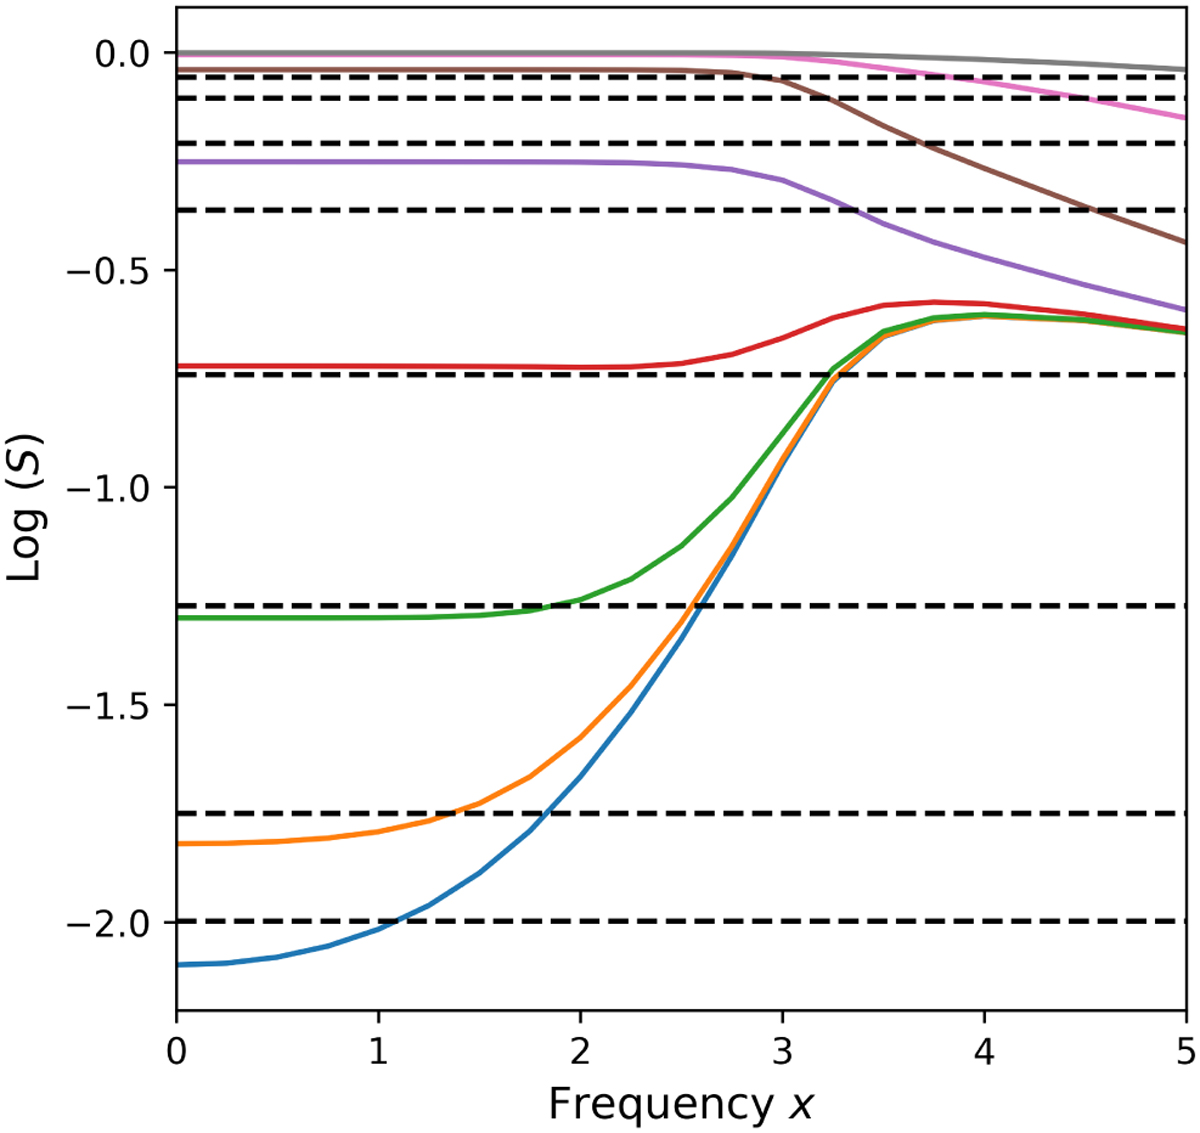
Validation of our iterative method for the full non-LTE transfer problem (compare with Fig. 3c of Hummer 1969). The normalized source function is displayed as a function of frequency at different line center optical depths within the atmosphere: namely at τ = 0, 1, 10, 100, 103, and 104. For comparison, we also show the corresponding CFR source function (constant with frequency) as dashed lines.
Current usage metrics show cumulative count of Article Views (full-text article views including HTML views, PDF and ePub downloads, according to the available data) and Abstracts Views on Vision4Press platform.
Data correspond to usage on the plateform after 2015. The current usage metrics is available 48-96 hours after online publication and is updated daily on week days.
Initial download of the metrics may take a while.