Open Access
Fig. 7
Download original image
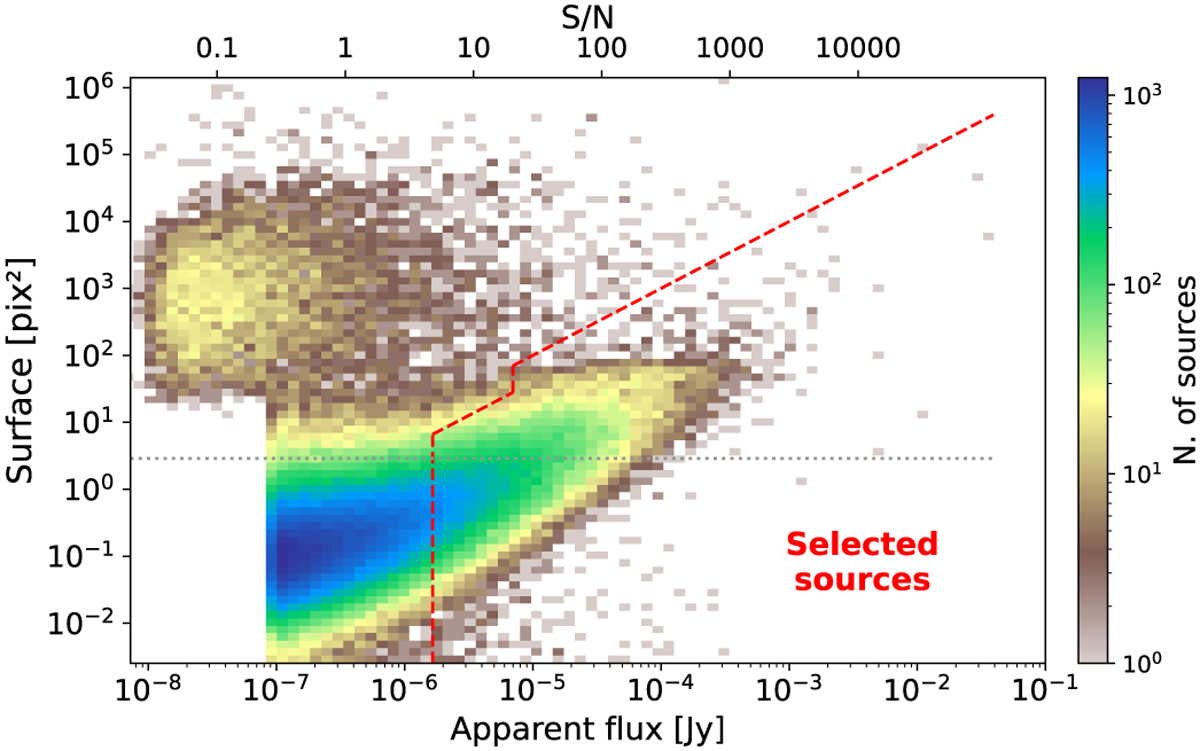
Two-dimensional histogram of the source surfaces as a function of their apparent flux. The dotted gray line indicates the saturated minimum surface with clipping. The red dashed line represents our selection function, with all the sources on the right of the line being selected.
Current usage metrics show cumulative count of Article Views (full-text article views including HTML views, PDF and ePub downloads, according to the available data) and Abstracts Views on Vision4Press platform.
Data correspond to usage on the plateform after 2015. The current usage metrics is available 48-96 hours after online publication and is updated daily on week days.
Initial download of the metrics may take a while.