Open Access
Fig. C.2
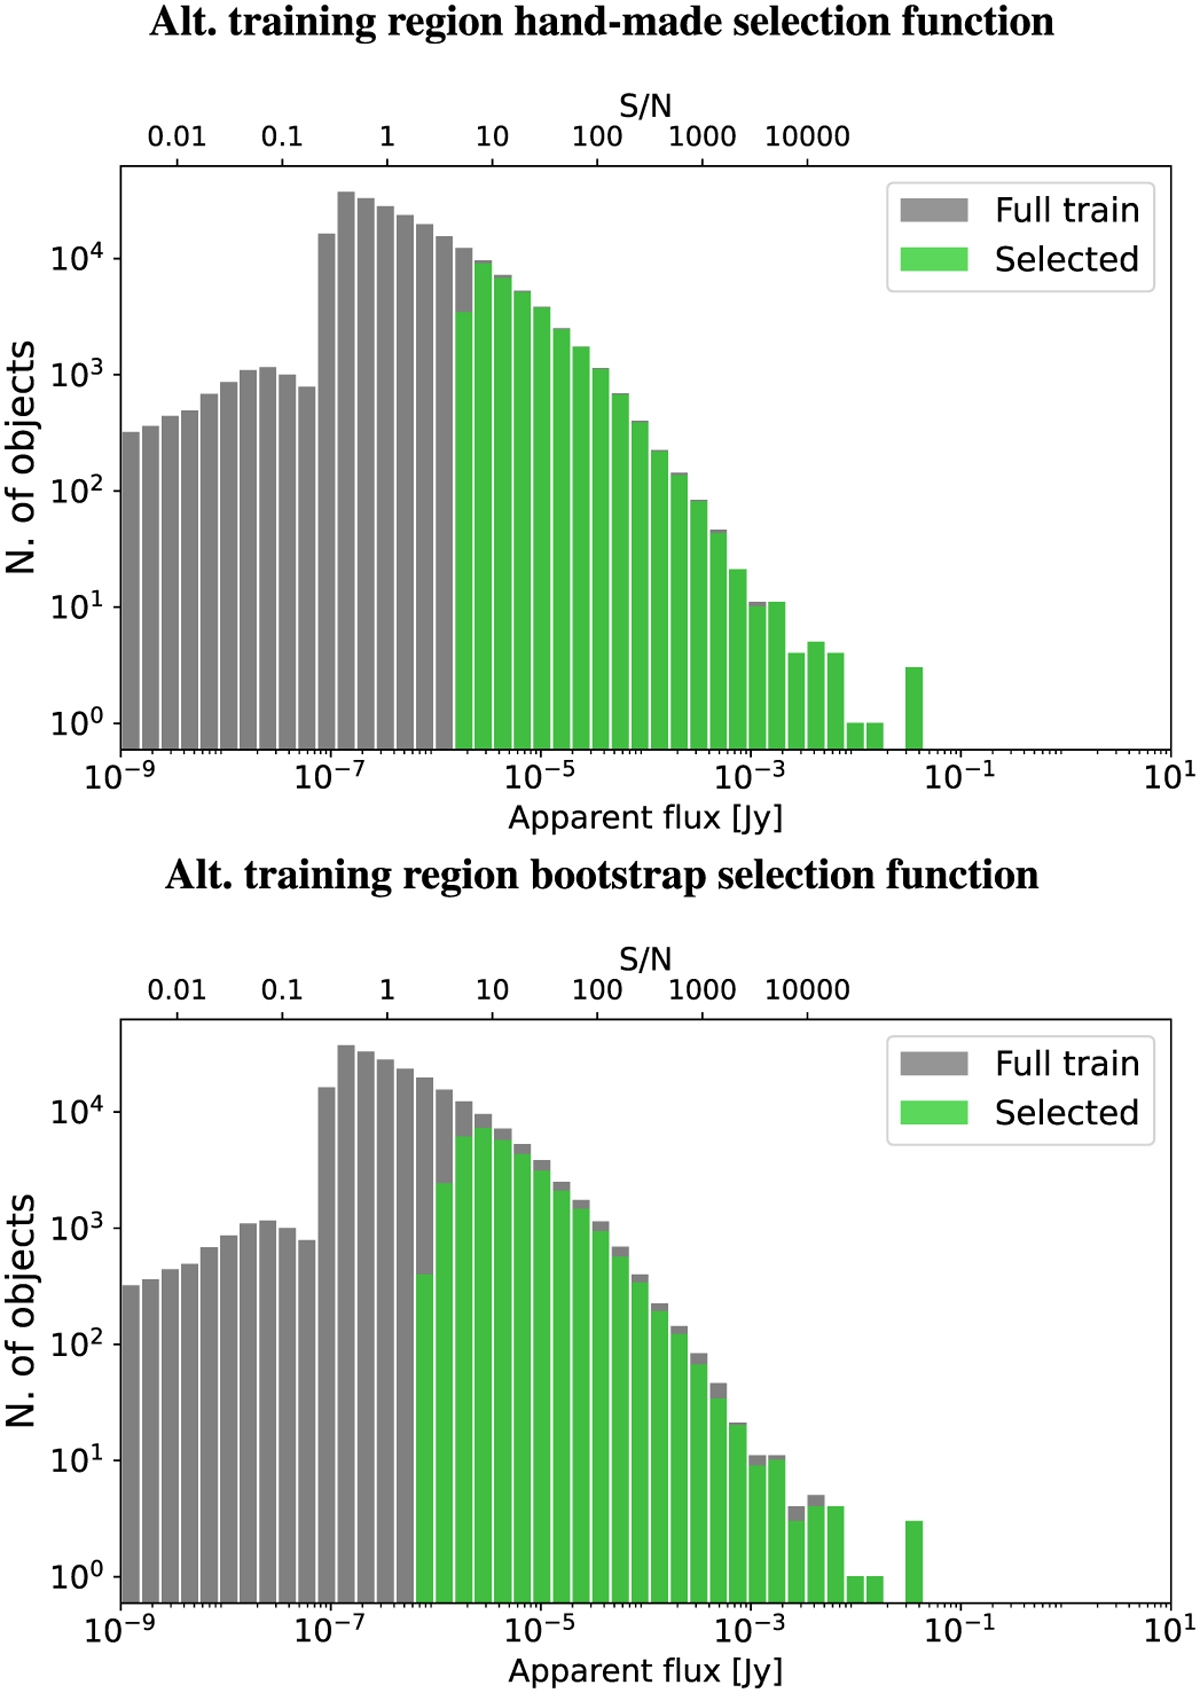
Download original image
Source flux distribution histogram in log scale and using log-bins for the True catalog and the selected sources in our alternative training. The top frame represents the classical selection function, and the bottom frame represents the bootstrap selection function after a single iteration.
Current usage metrics show cumulative count of Article Views (full-text article views including HTML views, PDF and ePub downloads, according to the available data) and Abstracts Views on Vision4Press platform.
Data correspond to usage on the plateform after 2015. The current usage metrics is available 48-96 hours after online publication and is updated daily on week days.
Initial download of the metrics may take a while.