Fig. A.2
Download original image
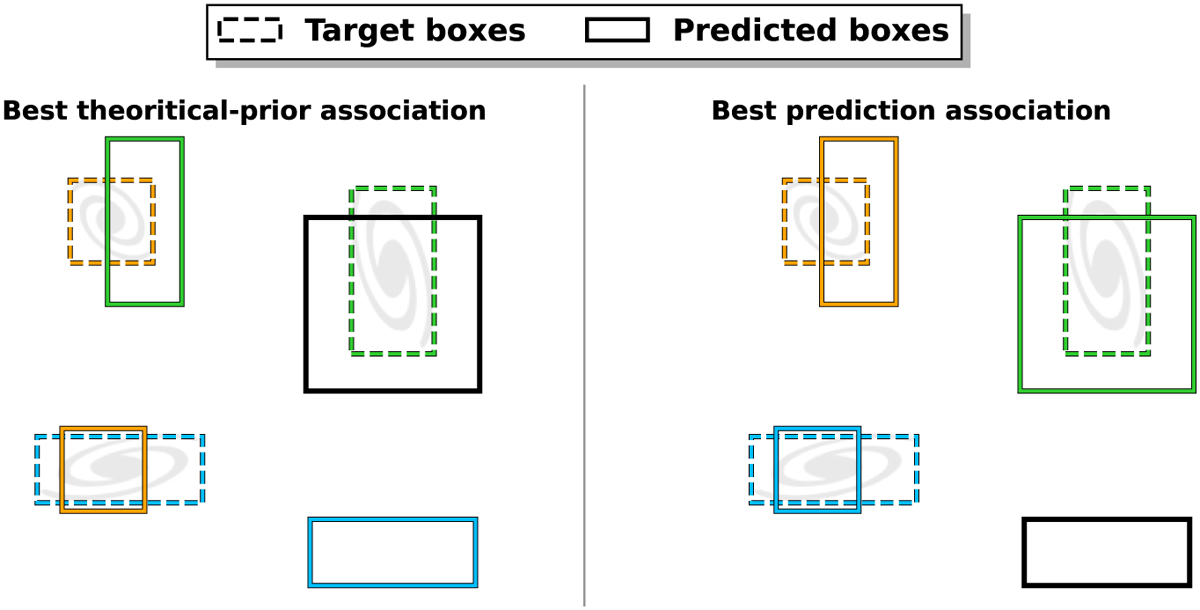
Comparison of the target-prediction association in a grid cell using two different association functions. The size of predicted boxes is considered close to the prior of their corresponding detection unit. The color indicates which prediction was associated with each target. The association results are illustrated for the default YOLO association function that is based on the best theoretical priors (left) and for an association function that uses the best current network prediction (right).
Current usage metrics show cumulative count of Article Views (full-text article views including HTML views, PDF and ePub downloads, according to the available data) and Abstracts Views on Vision4Press platform.
Data correspond to usage on the plateform after 2015. The current usage metrics is available 48-96 hours after online publication and is updated daily on week days.
Initial download of the metrics may take a while.