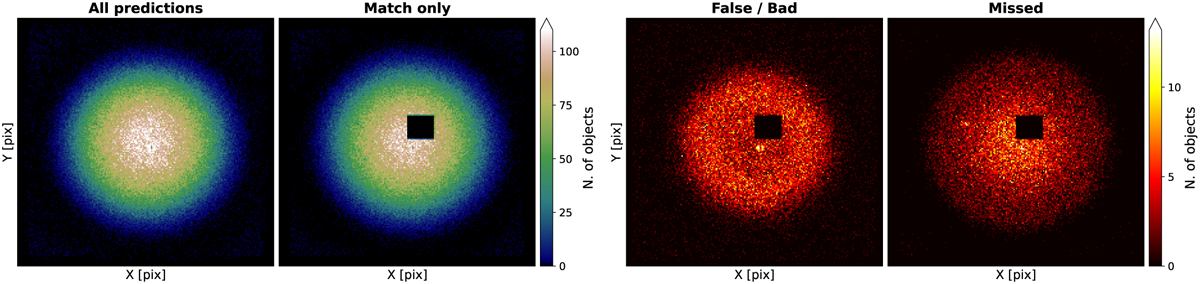
Fig. 21
Download original image
Two-dimensional histograms of various kinds of “objects” representing their distribution over the full SDC1 field for the YOLO-CIANNA model. The training area is masked when necessary. All densities are binned using the same 200x200 grid. The match and false detections are based on the scorer, while the missed ones are based on our selection function. The central coordinates of the field are RA = 0 deg, Dec = −30 deg.
Current usage metrics show cumulative count of Article Views (full-text article views including HTML views, PDF and ePub downloads, according to the available data) and Abstracts Views on Vision4Press platform.
Data correspond to usage on the plateform after 2015. The current usage metrics is available 48-96 hours after online publication and is updated daily on week days.
Initial download of the metrics may take a while.