Fig. 17
Download original image
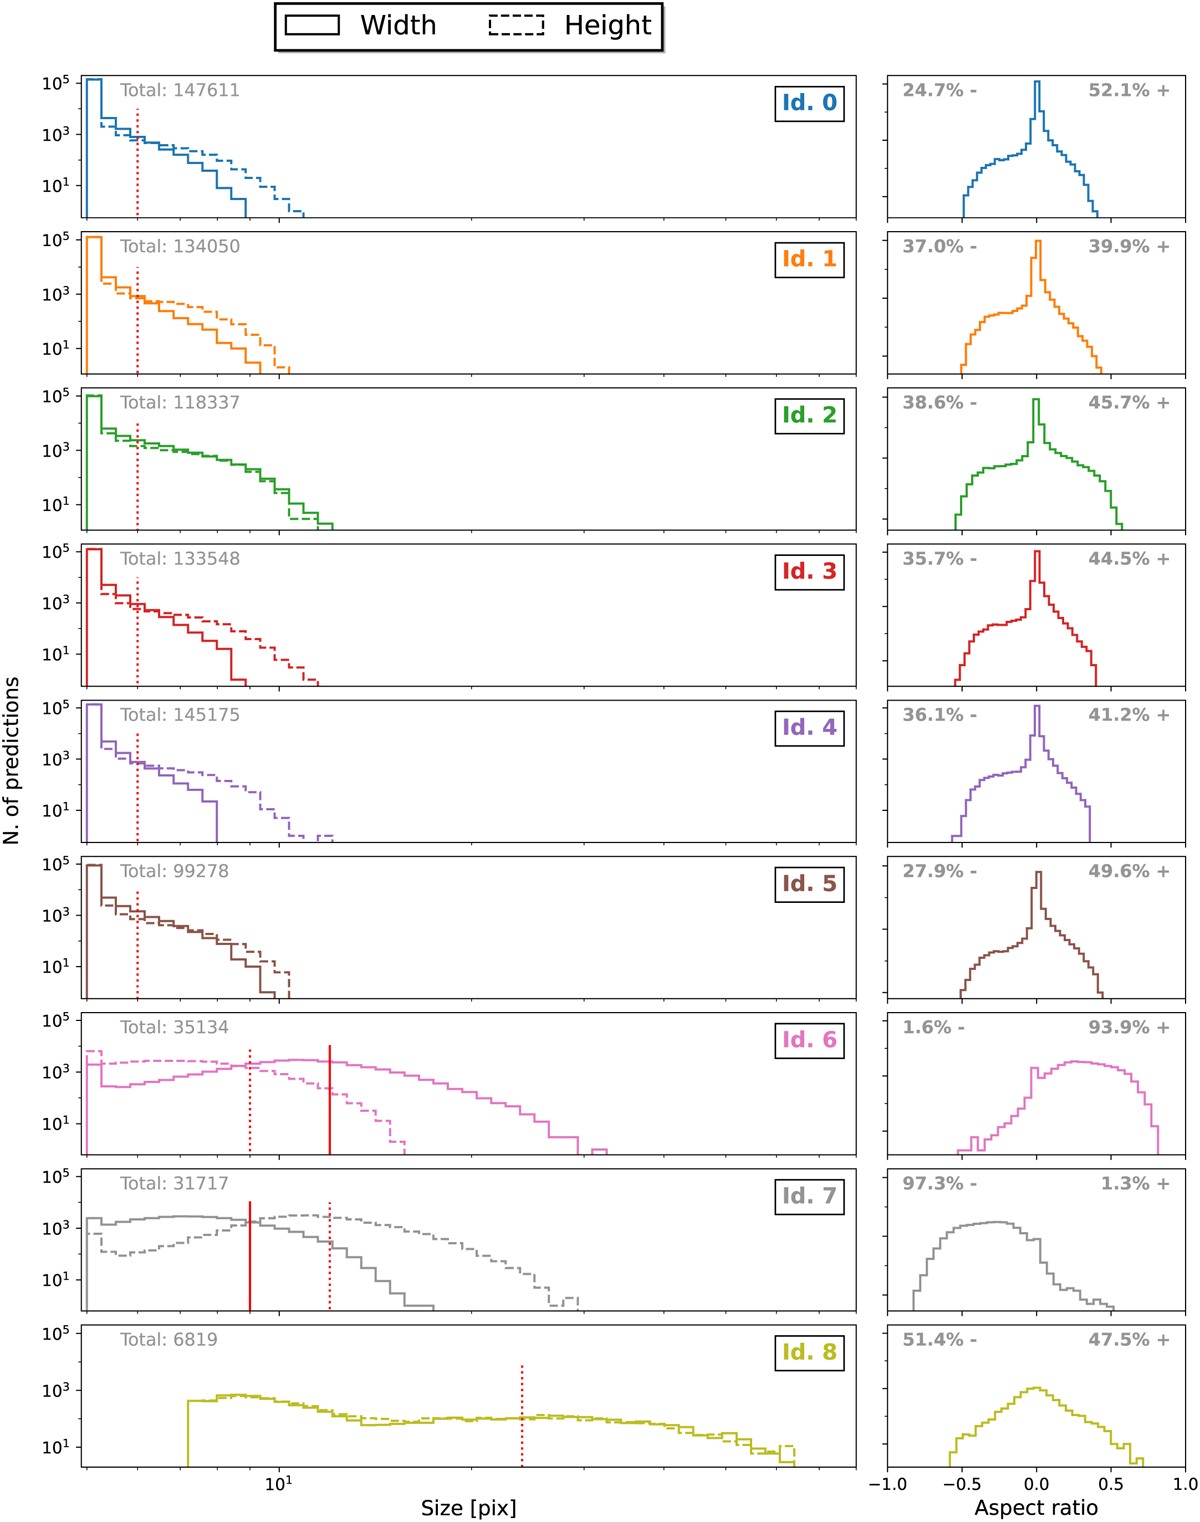
Histograms of the predicted heights, widths, and aspect ratios for every detection unit. The object count and size axes are in log scale. The aspect ratio is computed as (w − h)/ max (w, h). The number of predictions and the proportion of strictly positive and negative aspect ratios are also given for each detection unit. The red vertical lines indicate the width and height of the size priors.
Current usage metrics show cumulative count of Article Views (full-text article views including HTML views, PDF and ePub downloads, according to the available data) and Abstracts Views on Vision4Press platform.
Data correspond to usage on the plateform after 2015. The current usage metrics is available 48-96 hours after online publication and is updated daily on week days.
Initial download of the metrics may take a while.