Fig. 13
Download original image
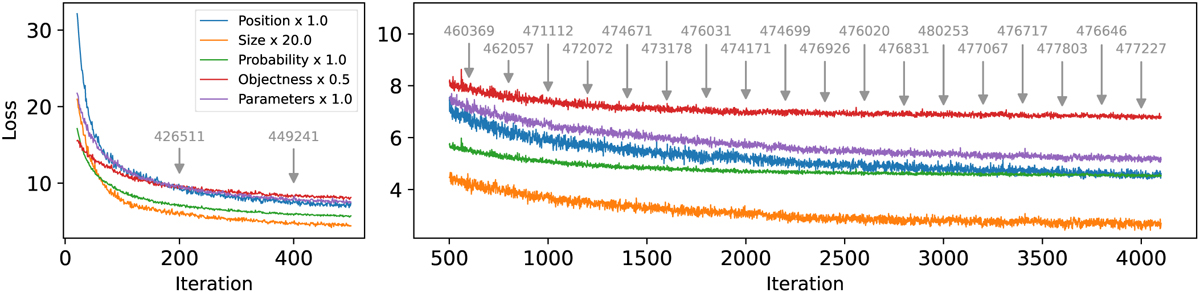
Evolution of the validation loss subparts during training, using the “natural” loss representation (Appendix A.7). The first 20 iterations are skipped. Optimized scores obtained using the procedure described in Sect. 3.9 are displayed every 200 iterations. The small difference in exact score that can be observed compared to Table 5 is due to rounding of the objectness thresholds, some minor adjustment of the largest prior threshold, and the use of FP16 mixed-precision at inference.
Current usage metrics show cumulative count of Article Views (full-text article views including HTML views, PDF and ePub downloads, according to the available data) and Abstracts Views on Vision4Press platform.
Data correspond to usage on the plateform after 2015. The current usage metrics is available 48-96 hours after online publication and is updated daily on week days.
Initial download of the metrics may take a while.