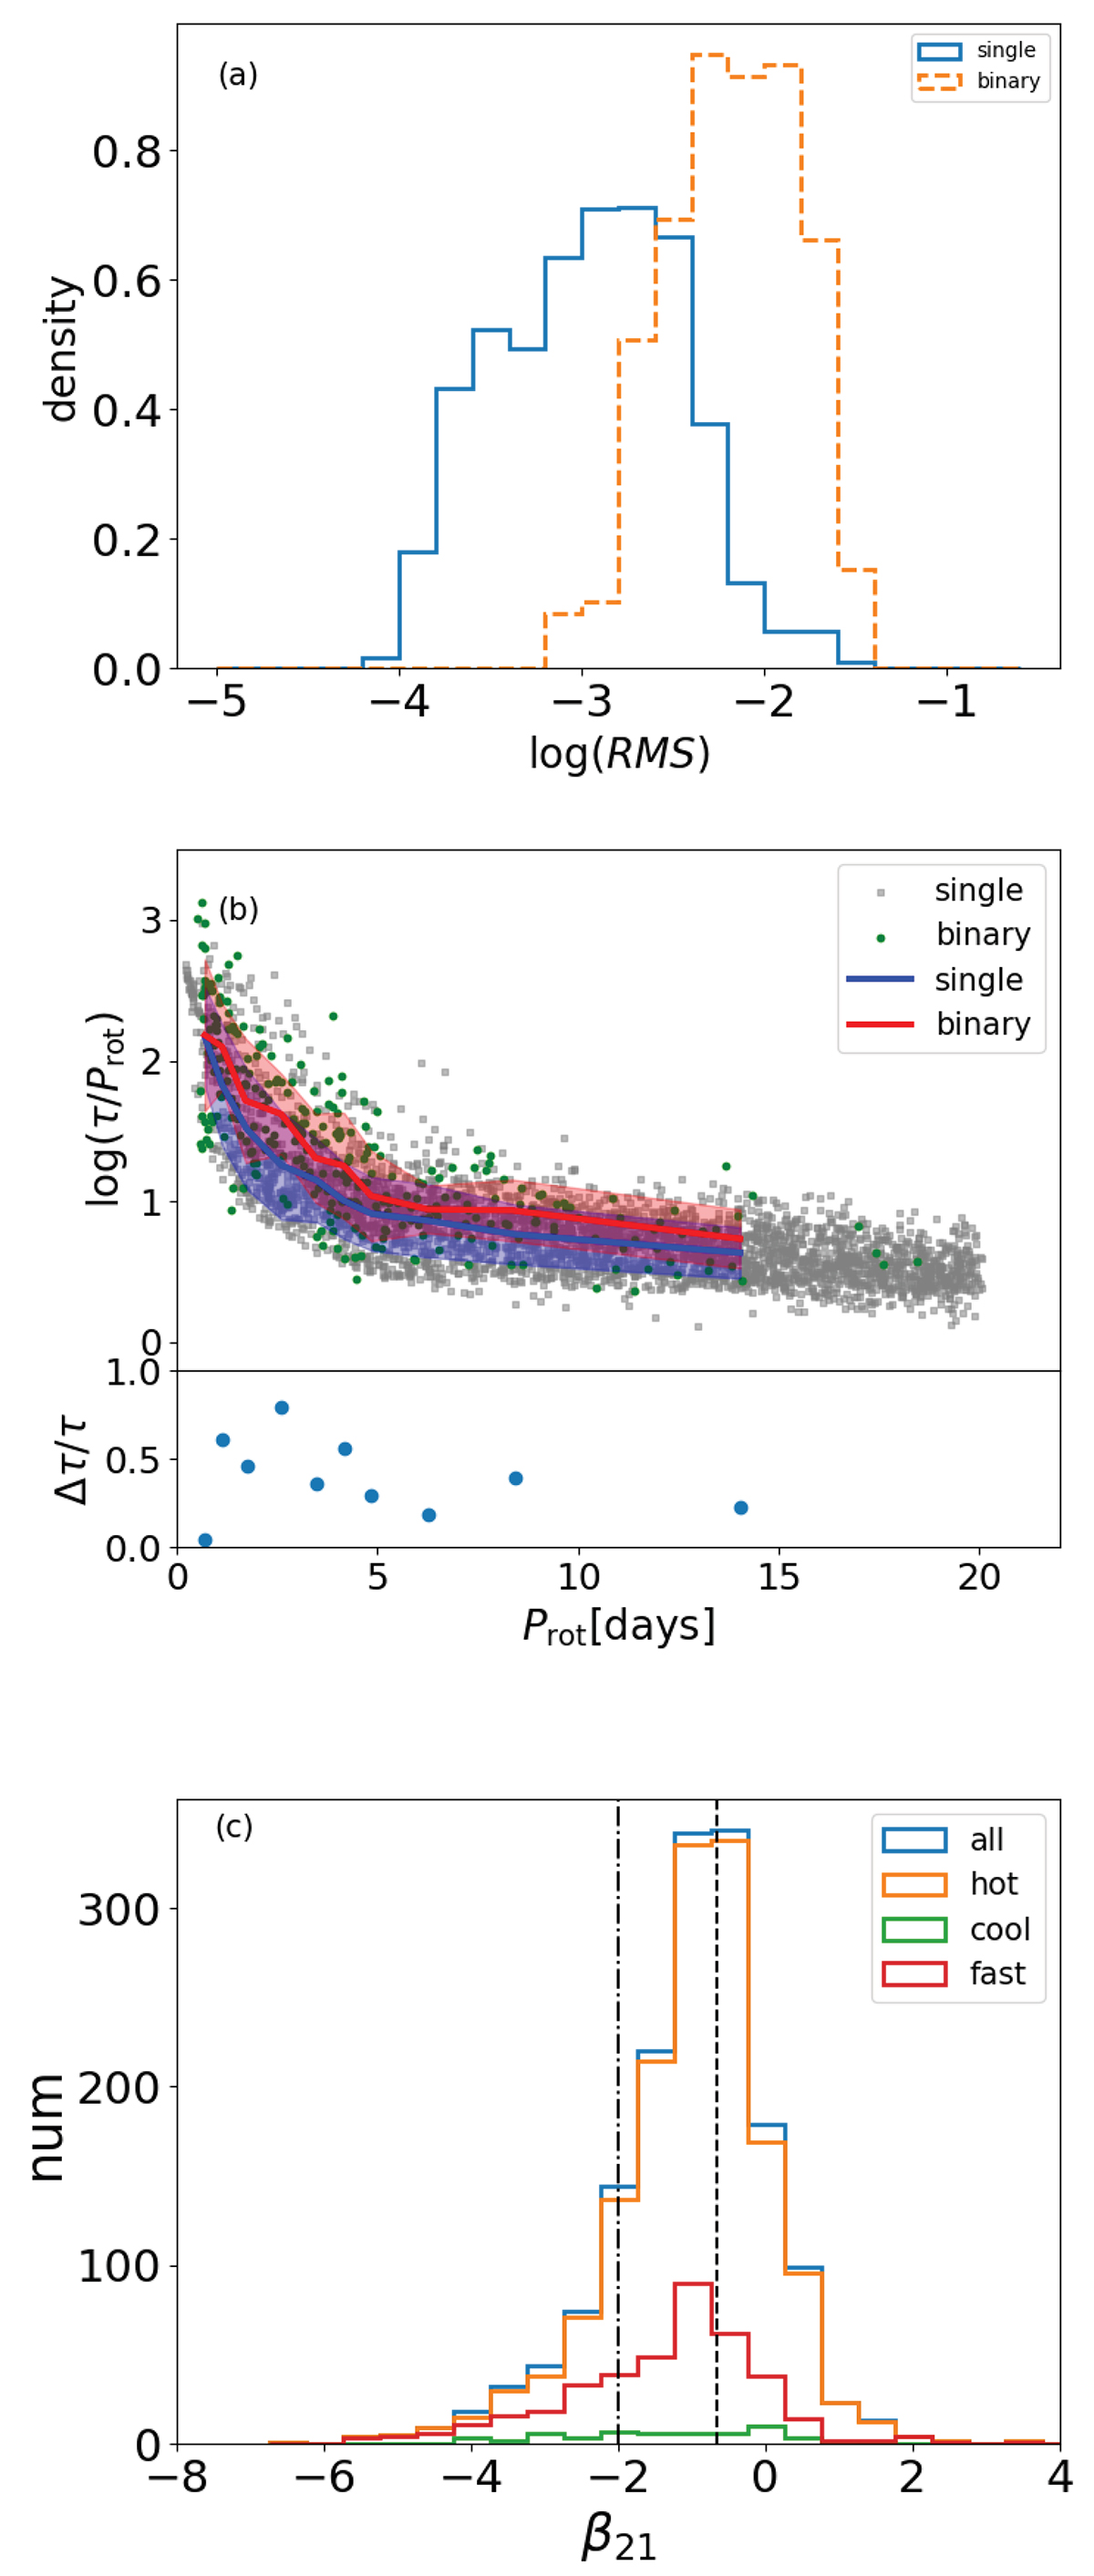
Fig. 9.
Download original image
Comparisons of binaries and single stars. (a) Histograms of the RMS. The blue and orange histograms show the single stars and binaries, respectively. The number of single stars is 5183. In the following panels, we only show the single stars with large RMS, whose number is 3272. (b) Comparison of the relative lifetimes of starspots on single stars and binaries. The top panel shows the relative lifetimes. The gray squares and green dots represent single stars and binaries, respectively. The blue and red bands show the 1σ regions for single stars and binaries, respectively. The blue and red lines show the mean τ/Prot of single stars and binaries, respectively. The bottom panel shows the differences in mean τ/Prot between binaries and single stars. The vertical axis represents the differences normalized by the relative lifetime, which is (Δτ/Prot)/(τ/Prot) (i.e., Δτ/τ). (c) β21 of single sources. The blue, orange, green, and red histograms show the total sample, the hot subsample (Teff > 5000 and Prot < 10 days), the cool subsample (Teff ≤ 5000 K and Prot < 10 days), and the fast-rotating subsample (Prot < 3 days), respectively.
Current usage metrics show cumulative count of Article Views (full-text article views including HTML views, PDF and ePub downloads, according to the available data) and Abstracts Views on Vision4Press platform.
Data correspond to usage on the plateform after 2015. The current usage metrics is available 48-96 hours after online publication and is updated daily on week days.
Initial download of the metrics may take a while.