Fig. 8.
Download original image
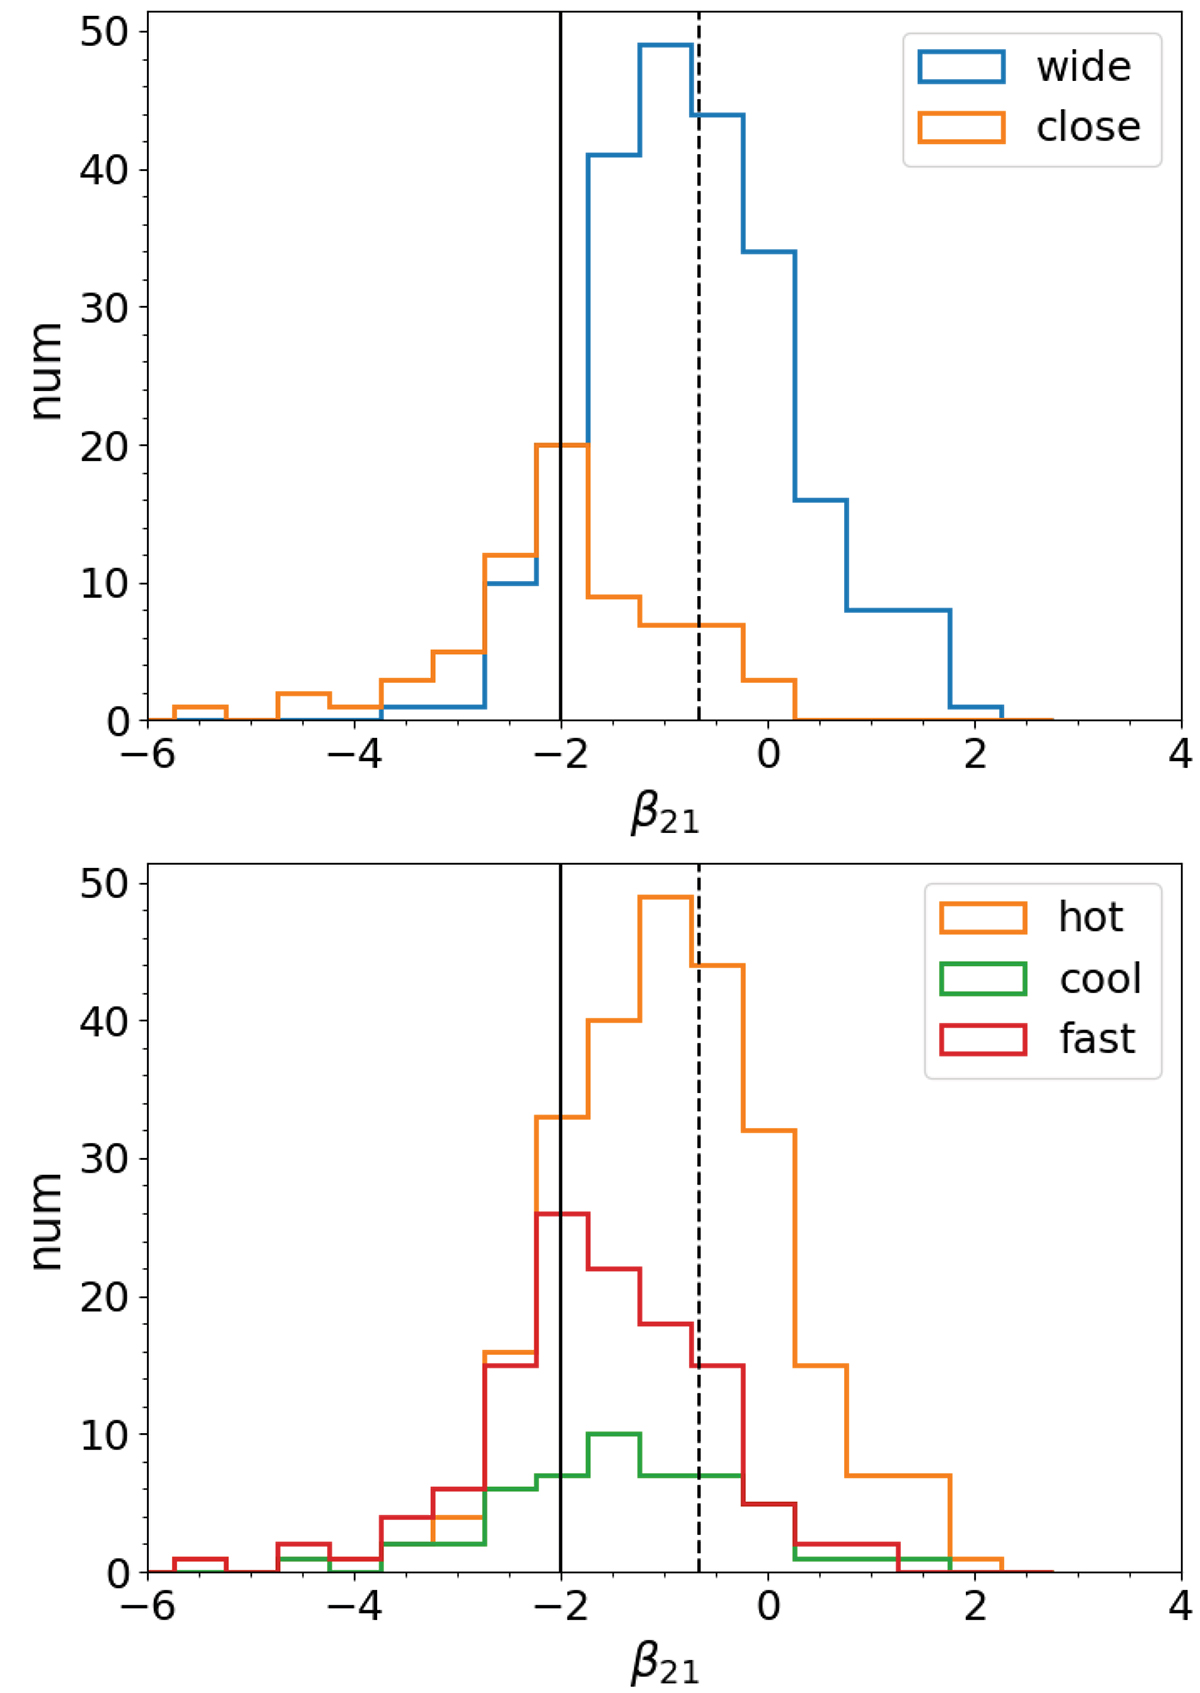
Histograms of β21. In the top panel, the blue and orange histograms are samples of wide ((R1 + R2)/a < 0.3) and close ((R1 + R2)/a ≥ 0.3) sources, respectively. In the bottom panel, the orange, green, and red histograms are samples of hot (Teff > 5000 K), cool (Teff ≤ 5000 K), and fast-rotating (Prot < 3 days) sources, respectively. The vertical solid and dashed lines label β21 of −2 and −2/3, respectively.
Current usage metrics show cumulative count of Article Views (full-text article views including HTML views, PDF and ePub downloads, according to the available data) and Abstracts Views on Vision4Press platform.
Data correspond to usage on the plateform after 2015. The current usage metrics is available 48-96 hours after online publication and is updated daily on week days.
Initial download of the metrics may take a while.