Fig. 7.
Download original image
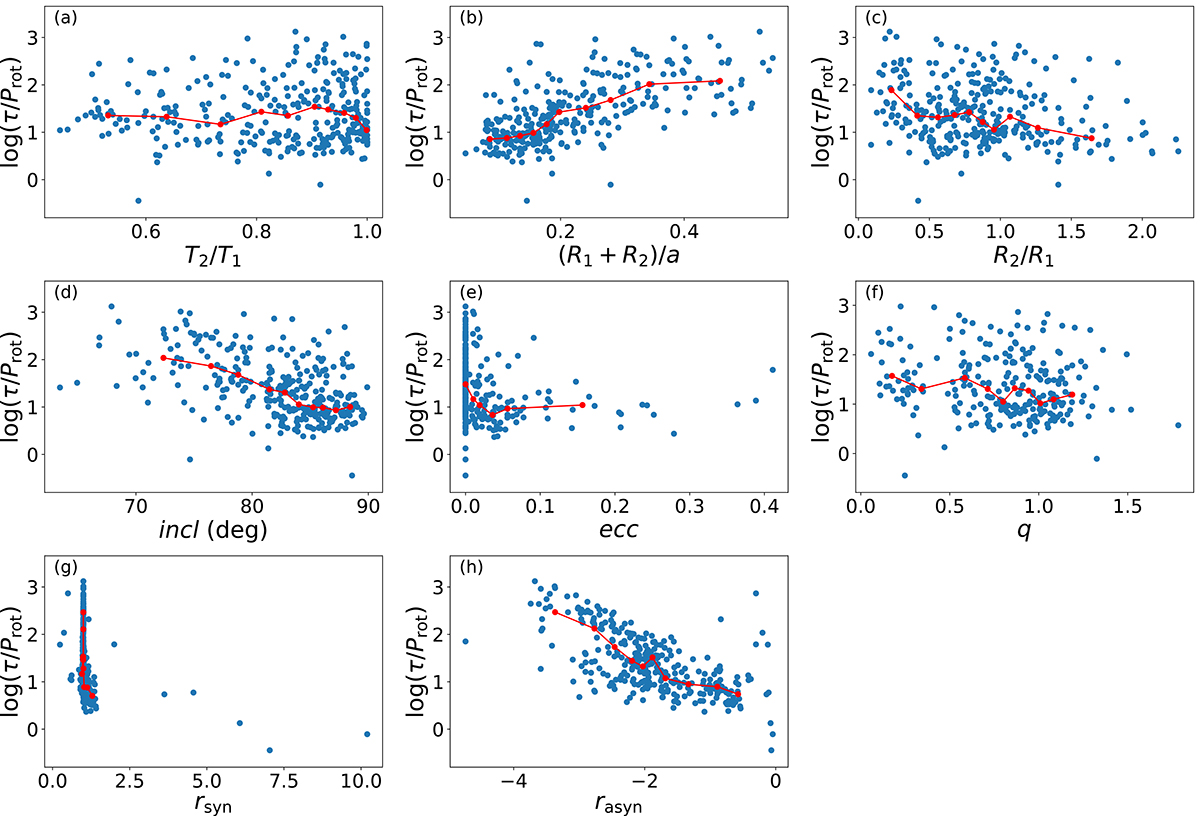
Correlation between the orbital parameters and the relative decay timescale of starspots. Since the relative decay time crosses about 3 orders of magnitude, the logarithmic scale is used to display them. The blue dots show the data from the entire sample. The red dots and lines represent the median of τ/Prot in the orbital parameter bins. For panel e, because the circular sources are plotted in one bin, only six medians are shown in panel e.
Current usage metrics show cumulative count of Article Views (full-text article views including HTML views, PDF and ePub downloads, according to the available data) and Abstracts Views on Vision4Press platform.
Data correspond to usage on the plateform after 2015. The current usage metrics is available 48-96 hours after online publication and is updated daily on week days.
Initial download of the metrics may take a while.