Fig. 2.
Download original image
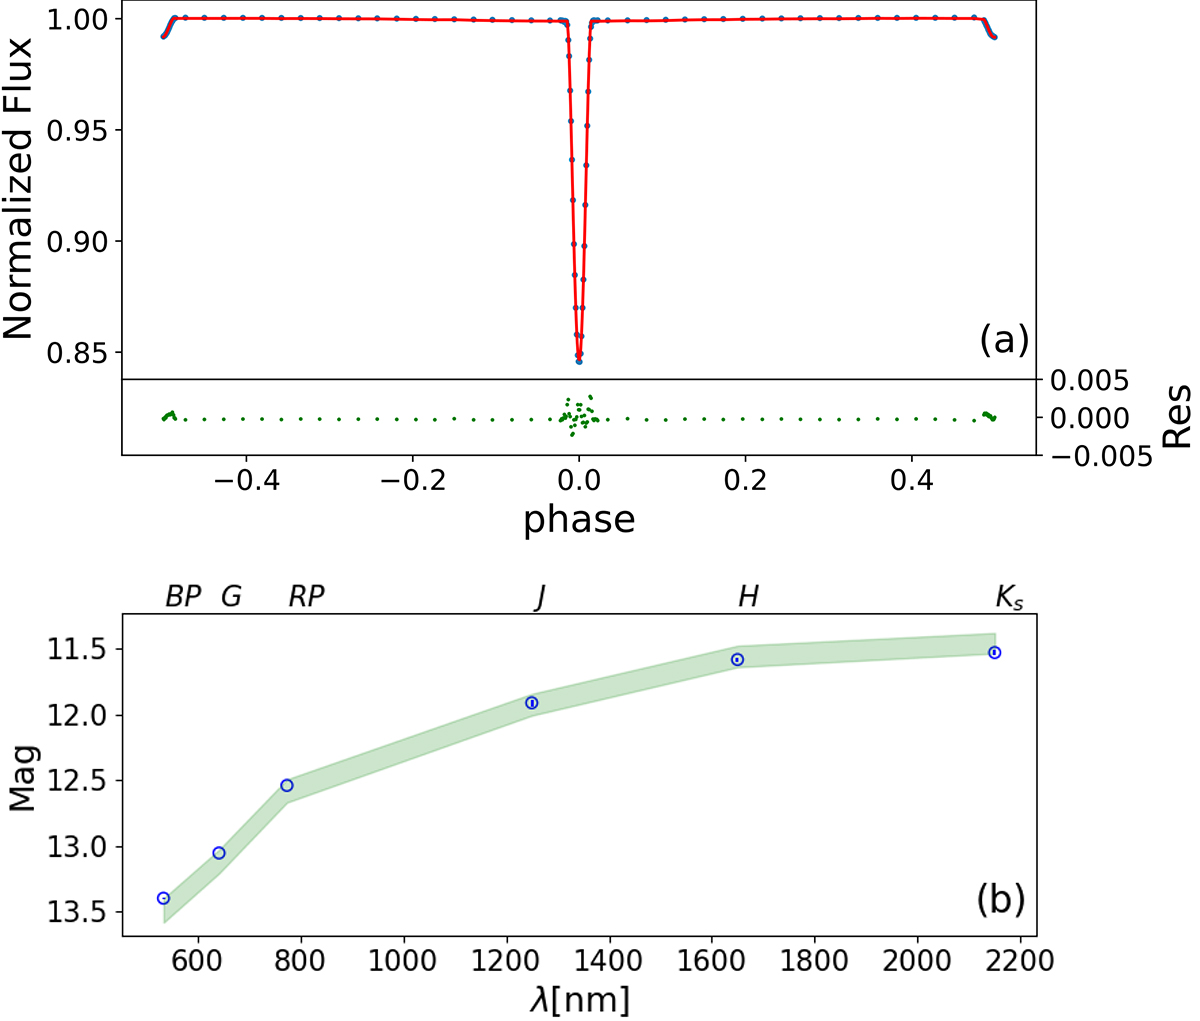
The photometry and model of binary. (a) Binary modeling of KIC 10935310. The top panel shows the light curve and the Phoebe model. The blue points show observational data, and the red lines show the best-fitting model. The lower panel shows the residuals. The green points show the fitting residuals. (b) SED fit for KIC 10935310. The blue circles with error bars show observational data. The error bars from Gaia photometry are barely visible because their error is smaller than mmag. The green bands show the SED models.
Current usage metrics show cumulative count of Article Views (full-text article views including HTML views, PDF and ePub downloads, according to the available data) and Abstracts Views on Vision4Press platform.
Data correspond to usage on the plateform after 2015. The current usage metrics is available 48-96 hours after online publication and is updated daily on week days.
Initial download of the metrics may take a while.