Fig. 1.
Download original image
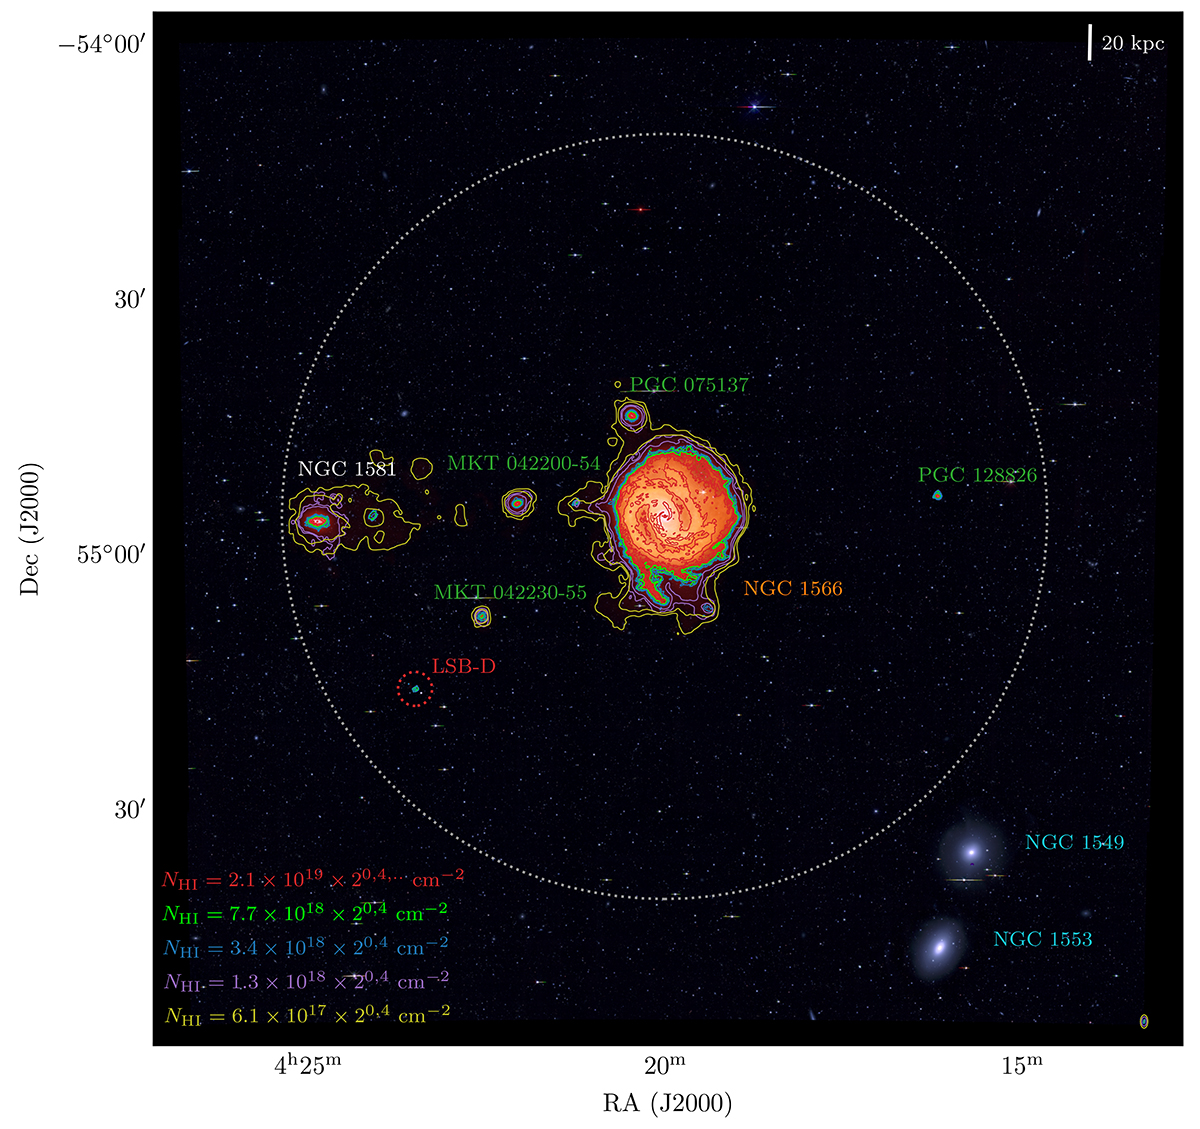
Primary beam corrected flux-density H I emission detected by MeerKAT within a 1.5 × 1.5 deg2 field centred on NGC 1566 (the imaged f.o.v. is marked by the dashed grey circle), overlaid on the DECaLS optical image in the g, r, z filters. The H I emission is a composite of flux-density maps derived from the multi-resolution datacubes. The resolutions shown by coloured contours are 12″ × 10″ (red), 25″×18″ (green), 32″×23″ (blue), 65″×64″ (purple), 94″×92″ (yellow-green). For resolutions between ∼90″ and 25″ two contours are shown, i.e., NH I = 3σ × 2n with n = 0, 2. The 12″×10″ resolution has further increasing contours (n = 0, 2, 4...). The PSF of the multi-resolution maps are shown in the bottom-right corner with the same colour coding. Details on the H I properties of the sources in the field are given in Table A.2.
Current usage metrics show cumulative count of Article Views (full-text article views including HTML views, PDF and ePub downloads, according to the available data) and Abstracts Views on Vision4Press platform.
Data correspond to usage on the plateform after 2015. The current usage metrics is available 48-96 hours after online publication and is updated daily on week days.
Initial download of the metrics may take a while.