Fig. 25
Download original image
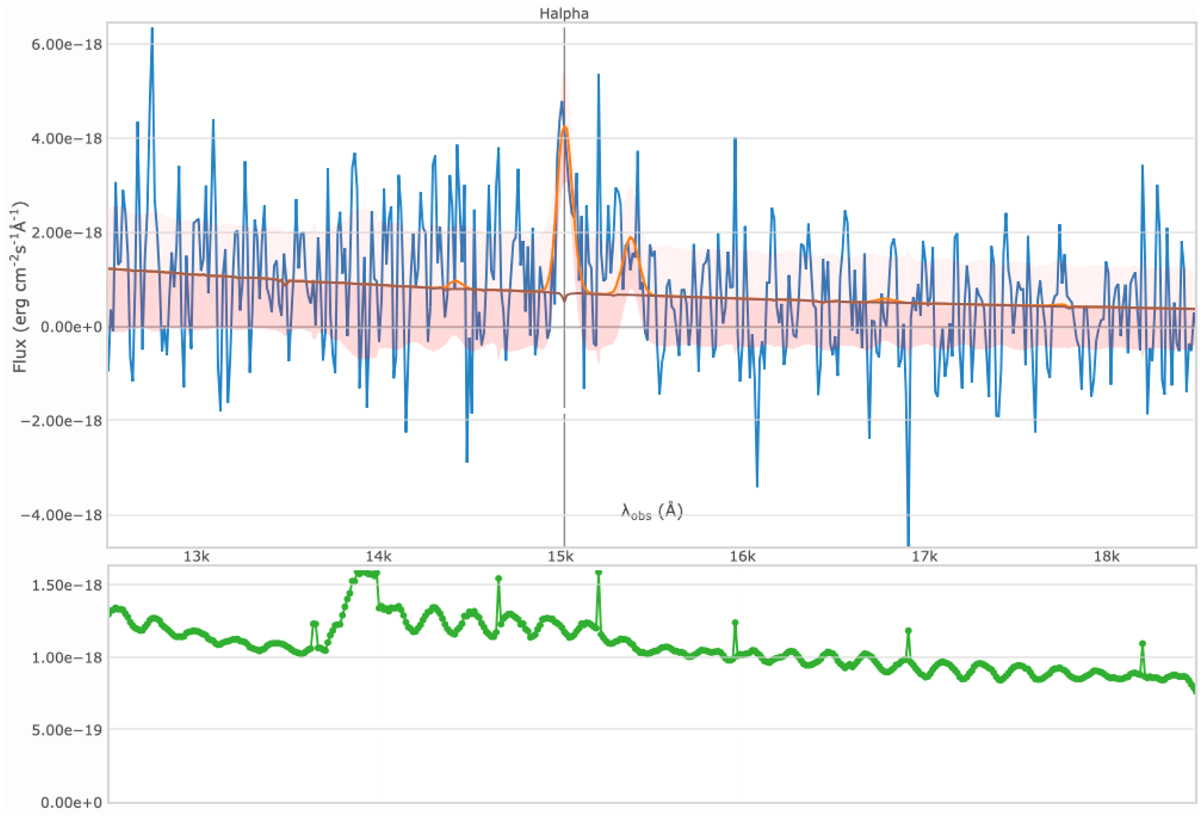
Stacked and processed spectra from simulated SC8 NISP-S images. The colours in the plot are identified as the following: blue line corresponds to the measured spectrum, brown line corresponds to continuum, orange line corresponds to model and green line corresponds to estimated noise. This galaxy was successfully identified at z = 1.29.
Current usage metrics show cumulative count of Article Views (full-text article views including HTML views, PDF and ePub downloads, according to the available data) and Abstracts Views on Vision4Press platform.
Data correspond to usage on the plateform after 2015. The current usage metrics is available 48-96 hours after online publication and is updated daily on week days.
Initial download of the metrics may take a while.