Fig. 22
Download original image
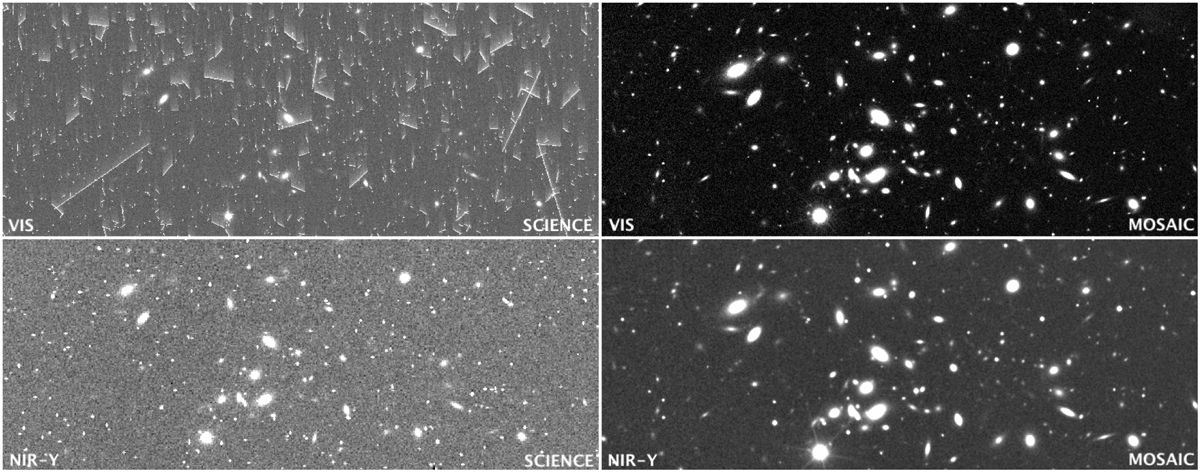
VIS and NIR imaging of a region in the SC8 deep field (Euclid ile 306182, Observation ID 1914) resulting from the different stages of the SGS processing flow. The two panels on the left show the simulated raw science frames for the VIS IE band (top-left), and NISP-P YE band (bottom-left). The right panels show the background-subtracted mosaic images (see text for details) of the same field for the VIS IE band (top-right) and NISP-P YE band (bottom-right), produced, respectively, during level-2 data-processing by the Organization Unit for Merging (OU-MER) pipeline.
Current usage metrics show cumulative count of Article Views (full-text article views including HTML views, PDF and ePub downloads, according to the available data) and Abstracts Views on Vision4Press platform.
Data correspond to usage on the plateform after 2015. The current usage metrics is available 48-96 hours after online publication and is updated daily on week days.
Initial download of the metrics may take a while.