Fig. 20
Download original image
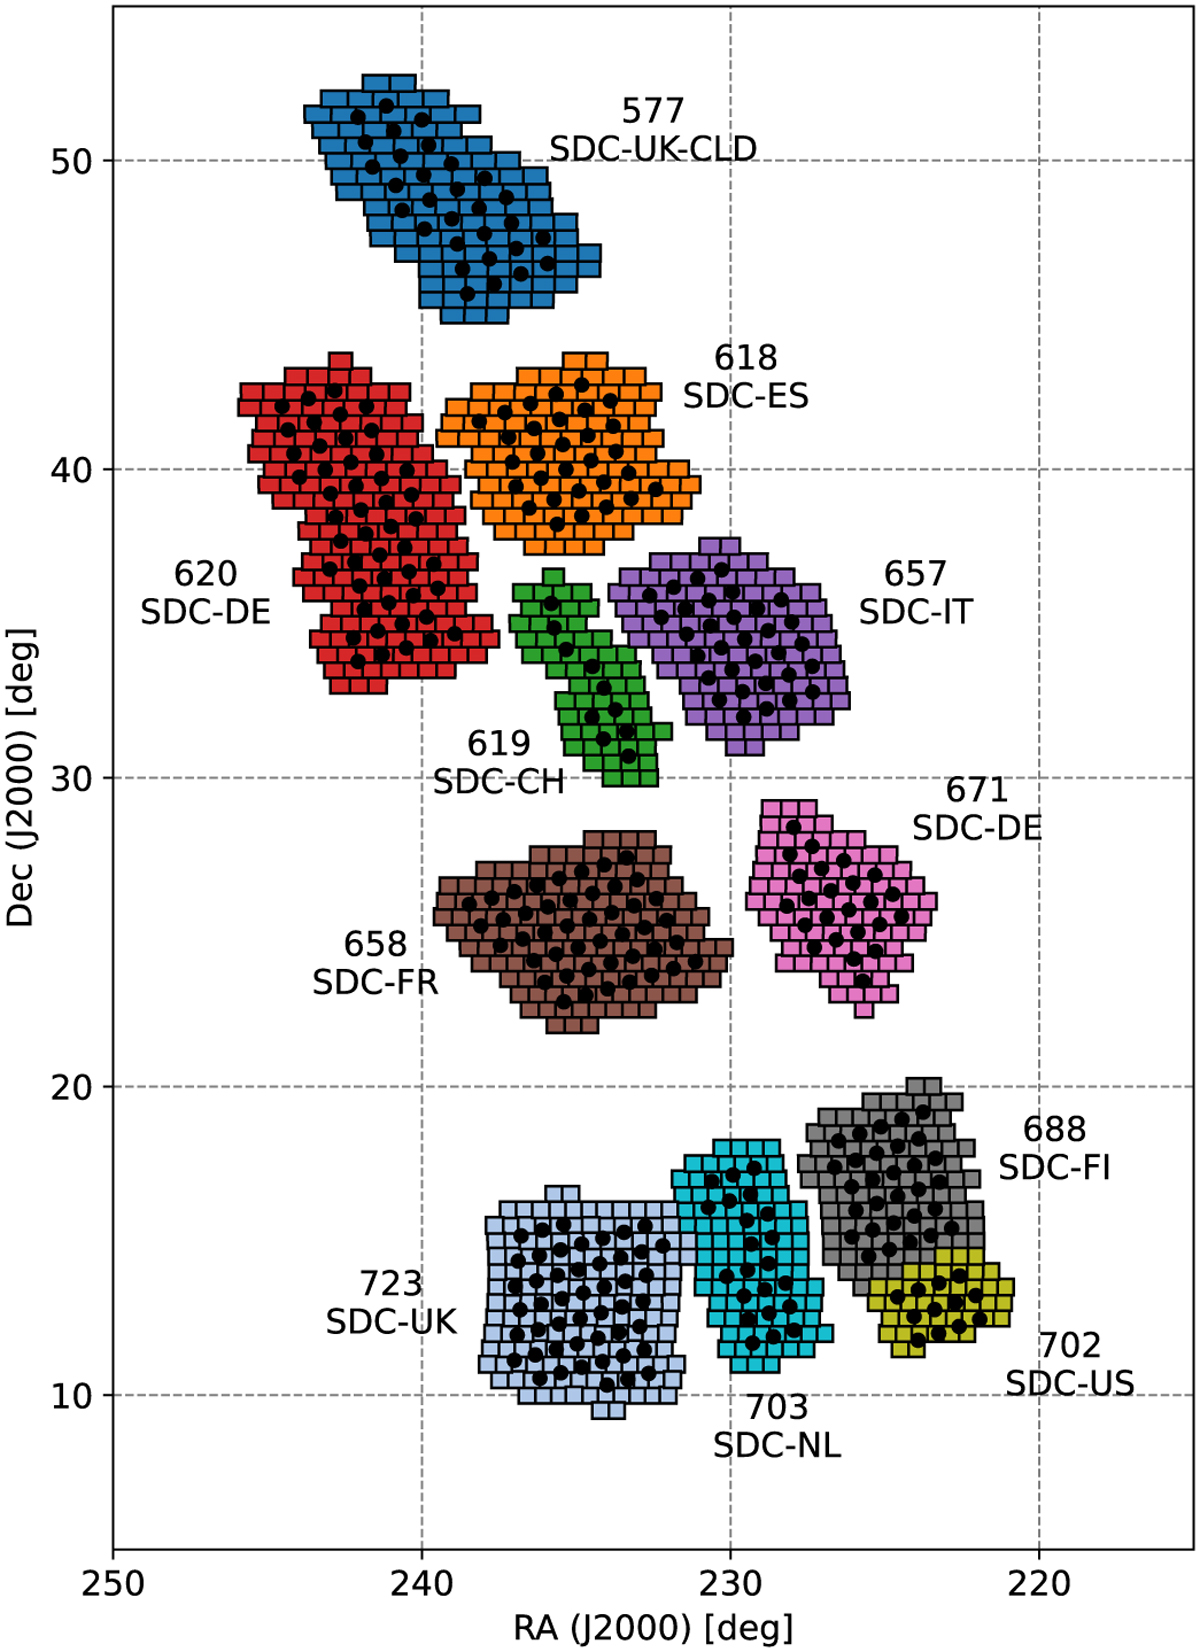
Distribution of the processing for the SC8 main production among the SDCs. The labels in the image indicate the patch identifier and the corresponding SDC responsible of processing the entire patch containing all Euclid pointings and the overlapping EXT surveys. The black dots denote each of the 331 observations of the Euclid Wide Survey and the squares represent the 1036 Euclid processing tiles.
Current usage metrics show cumulative count of Article Views (full-text article views including HTML views, PDF and ePub downloads, according to the available data) and Abstracts Views on Vision4Press platform.
Data correspond to usage on the plateform after 2015. The current usage metrics is available 48-96 hours after online publication and is updated daily on week days.
Initial download of the metrics may take a while.