Open Access
Fig. 18
Download original image
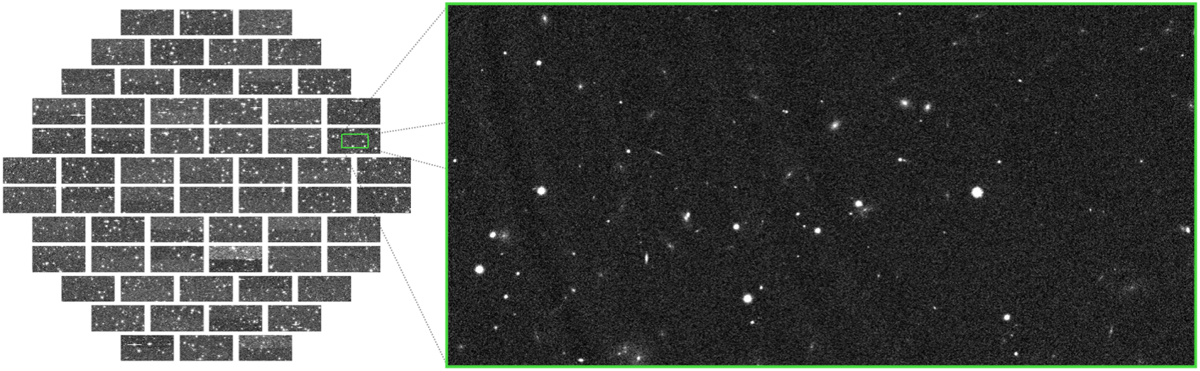
Simulated DES exposure in the r band. The left image shows the entire 62 detector mosaic covering a ![]() diameter field of view. The right image shows a detailed 10′ wide section of a single detector.
diameter field of view. The right image shows a detailed 10′ wide section of a single detector.
Current usage metrics show cumulative count of Article Views (full-text article views including HTML views, PDF and ePub downloads, according to the available data) and Abstracts Views on Vision4Press platform.
Data correspond to usage on the plateform after 2015. The current usage metrics is available 48-96 hours after online publication and is updated daily on week days.
Initial download of the metrics may take a while.