Open Access
Fig. 16
Download original image
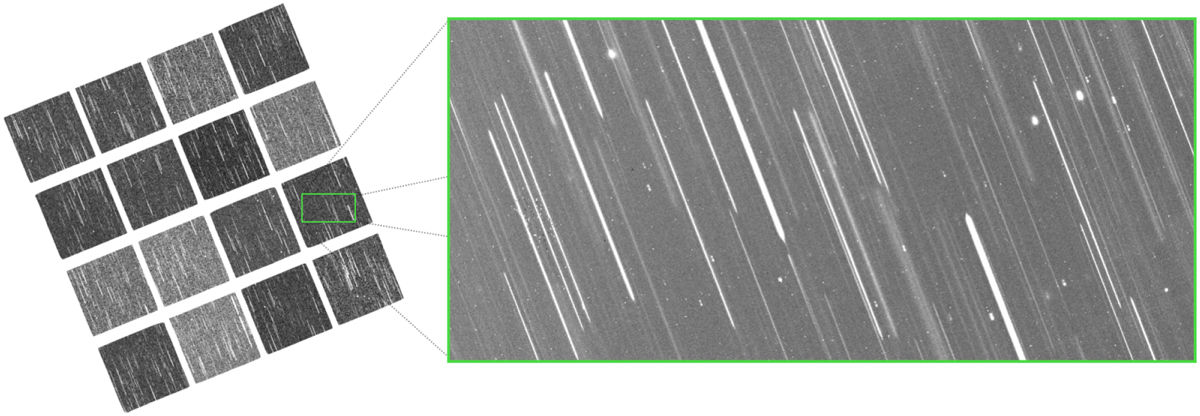
Simulated NISP-S exposure. The left image shows the entire 4 × 4 mosaic of infrared detectors and the right image contains a zoomed in fraction of a single detector, showing a typical slit-less spectroscopy of the NISP-S with 0th, 1st, and 2nd order dispersed spectra.
Current usage metrics show cumulative count of Article Views (full-text article views including HTML views, PDF and ePub downloads, according to the available data) and Abstracts Views on Vision4Press platform.
Data correspond to usage on the plateform after 2015. The current usage metrics is available 48-96 hours after online publication and is updated daily on week days.
Initial download of the metrics may take a while.