Fig. 13
Download original image
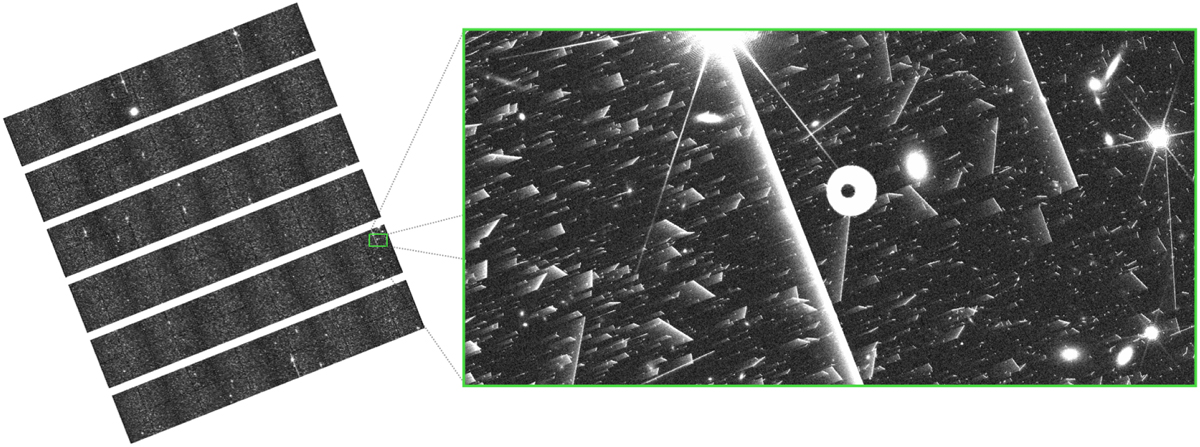
Simulated VIS exposure. The left image shows the entire 6 × 6 mosaic of detectors and the right image contains a zoomed in fraction of a quadrant, where the multiple effects can be seen such as bright stars, galaxies, cosmic rays, a complex PSF model, a ghost from a nearby star, saturation bleeding, and the trails of the Charge Transfer Inefficiency (CTI) increasingly visible in the readout direction. In this image, the end-of-life model for the CTI was adopted. A linear scale around the median with only 30 ADUs of range was used to visualise the subtle instrumental effects present in the simulation.
Current usage metrics show cumulative count of Article Views (full-text article views including HTML views, PDF and ePub downloads, according to the available data) and Abstracts Views on Vision4Press platform.
Data correspond to usage on the plateform after 2015. The current usage metrics is available 48-96 hours after online publication and is updated daily on week days.
Initial download of the metrics may take a while.