Fig. 7.
Download original image
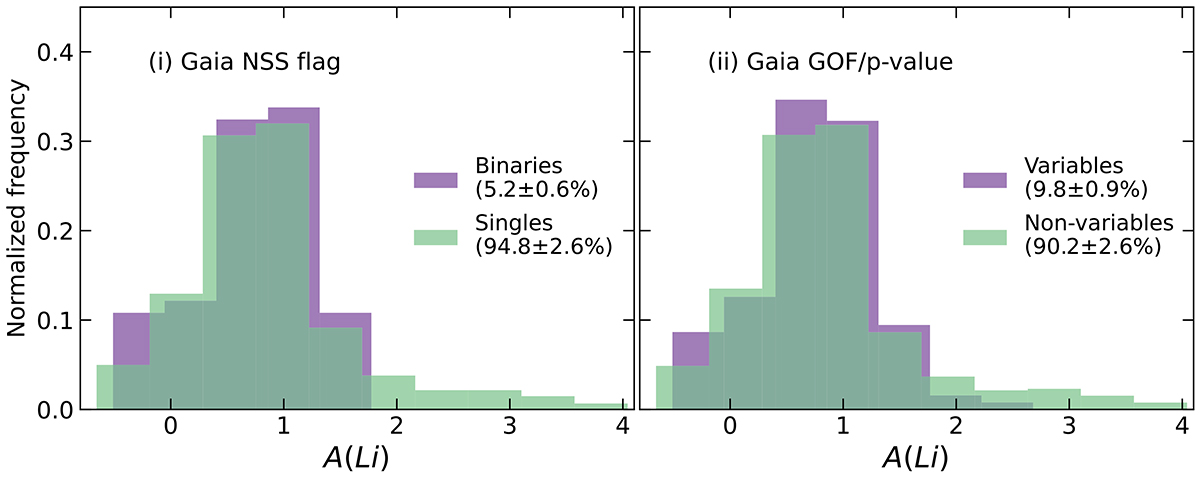
First panel (i): A(Li) distribution for the red giants identified as binaries and singles using the non-single star (NSS) flag provided by Gaia DR3. Second panel (ii): A(Li) distribution for the red giants identified as variables and non-variables using the p-value for constancy and the radial velocity renormalized goodness of fit (GoF) reported in Gaia DR3 following the method described by Katz et al. (2023).
Current usage metrics show cumulative count of Article Views (full-text article views including HTML views, PDF and ePub downloads, according to the available data) and Abstracts Views on Vision4Press platform.
Data correspond to usage on the plateform after 2015. The current usage metrics is available 48-96 hours after online publication and is updated daily on week days.
Initial download of the metrics may take a while.