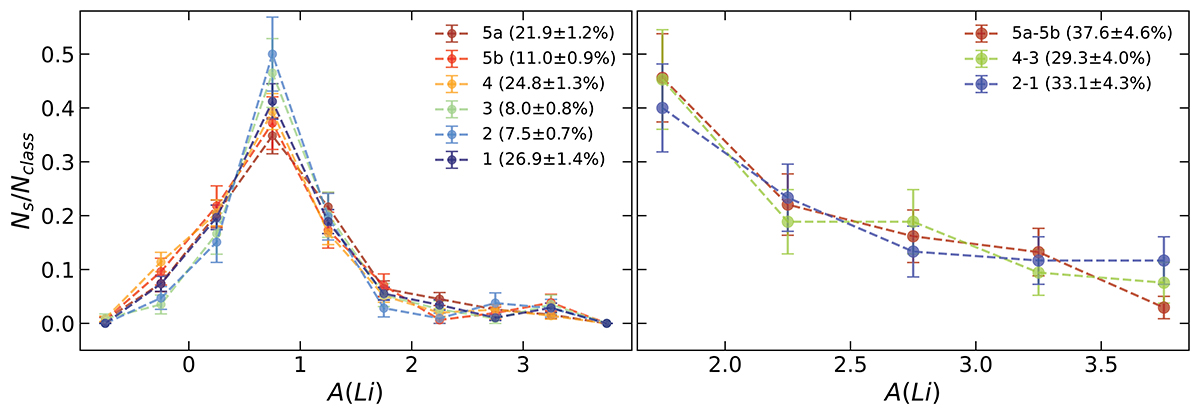
Fig. 6.
Download original image
The left panel shows the A(Li) distribution for each class of variability obtained for the giants. We note that Ns/Nclass is the fraction of stars in a class for the corresponding bin of A(Li). The percentages represent the fraction in each class just like in Table 2. The right panel shows the A(Li) distribution for each joint class of variability obtained for the Li-rich (A(Li) > 1.5) giants. For this case, the variability is high for class 5a-5b, medium for class 4-3, and low for class 2-1; the percentages represent the fraction of giants in each joint class for the total Li-rich giants with errors obtained following the same method applied in Table 2.
Current usage metrics show cumulative count of Article Views (full-text article views including HTML views, PDF and ePub downloads, according to the available data) and Abstracts Views on Vision4Press platform.
Data correspond to usage on the plateform after 2015. The current usage metrics is available 48-96 hours after online publication and is updated daily on week days.
Initial download of the metrics may take a while.