Fig. 4.
Download original image
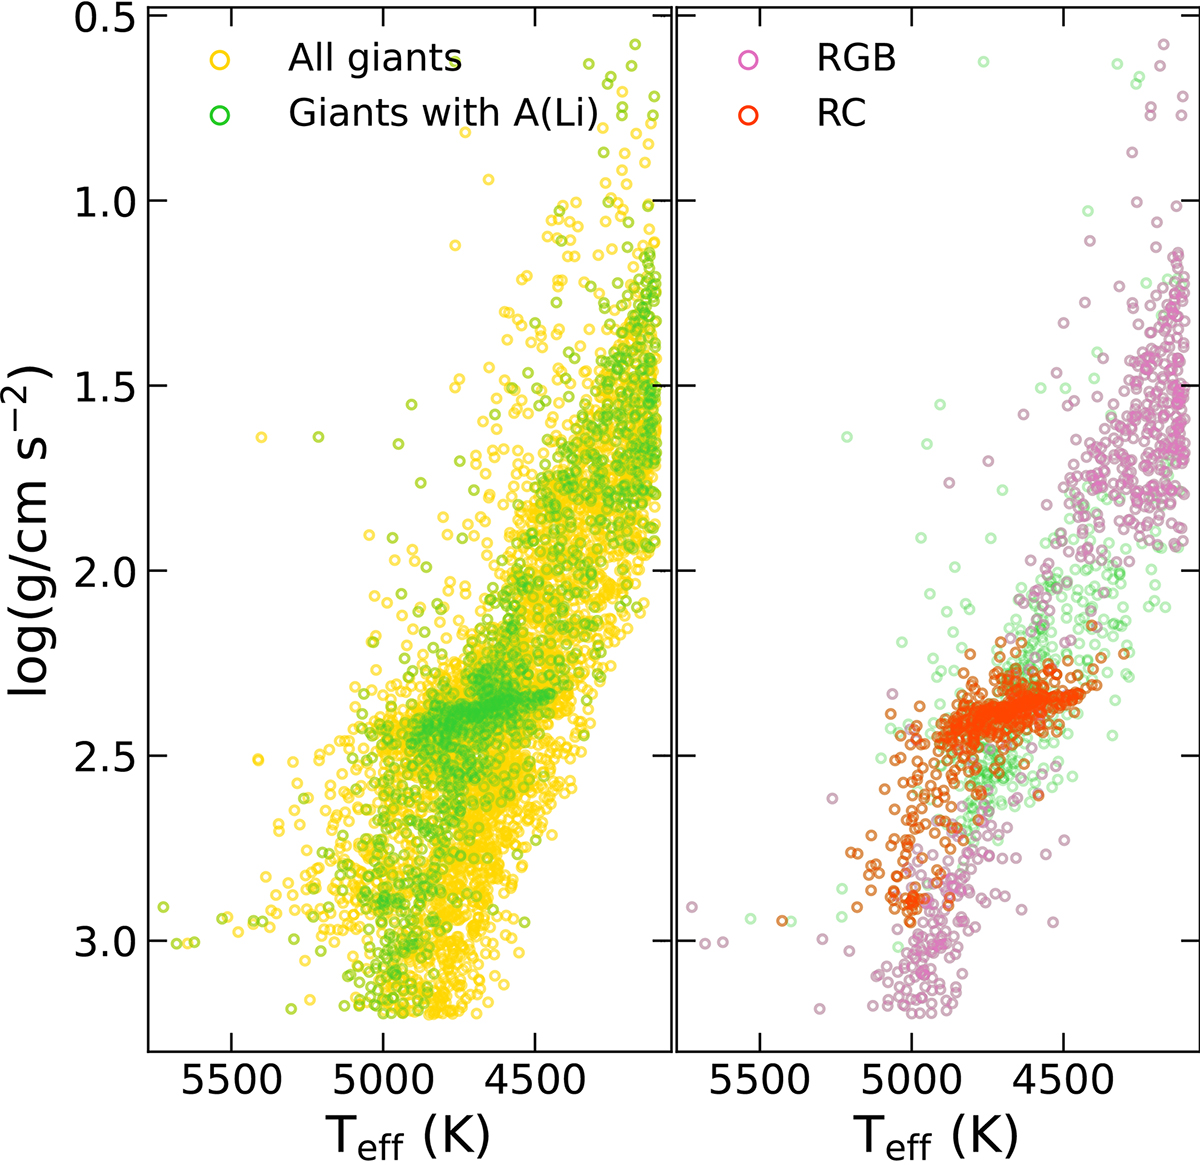
The left panel shows the log(g)-Teff diagram for all the red giants found with RVs reported simultaneously in Gaia DR3, GALAH DR3, and RAVE DR6 (yellow), and for those which also have a Li abundance reported in GALAH DR3 (green). The right panel shows the log(g)-Teff diagram for RGB (pink) and RC (orange) giants in our sample of giants with Li abundance (green background).
Current usage metrics show cumulative count of Article Views (full-text article views including HTML views, PDF and ePub downloads, according to the available data) and Abstracts Views on Vision4Press platform.
Data correspond to usage on the plateform after 2015. The current usage metrics is available 48-96 hours after online publication and is updated daily on week days.
Initial download of the metrics may take a while.