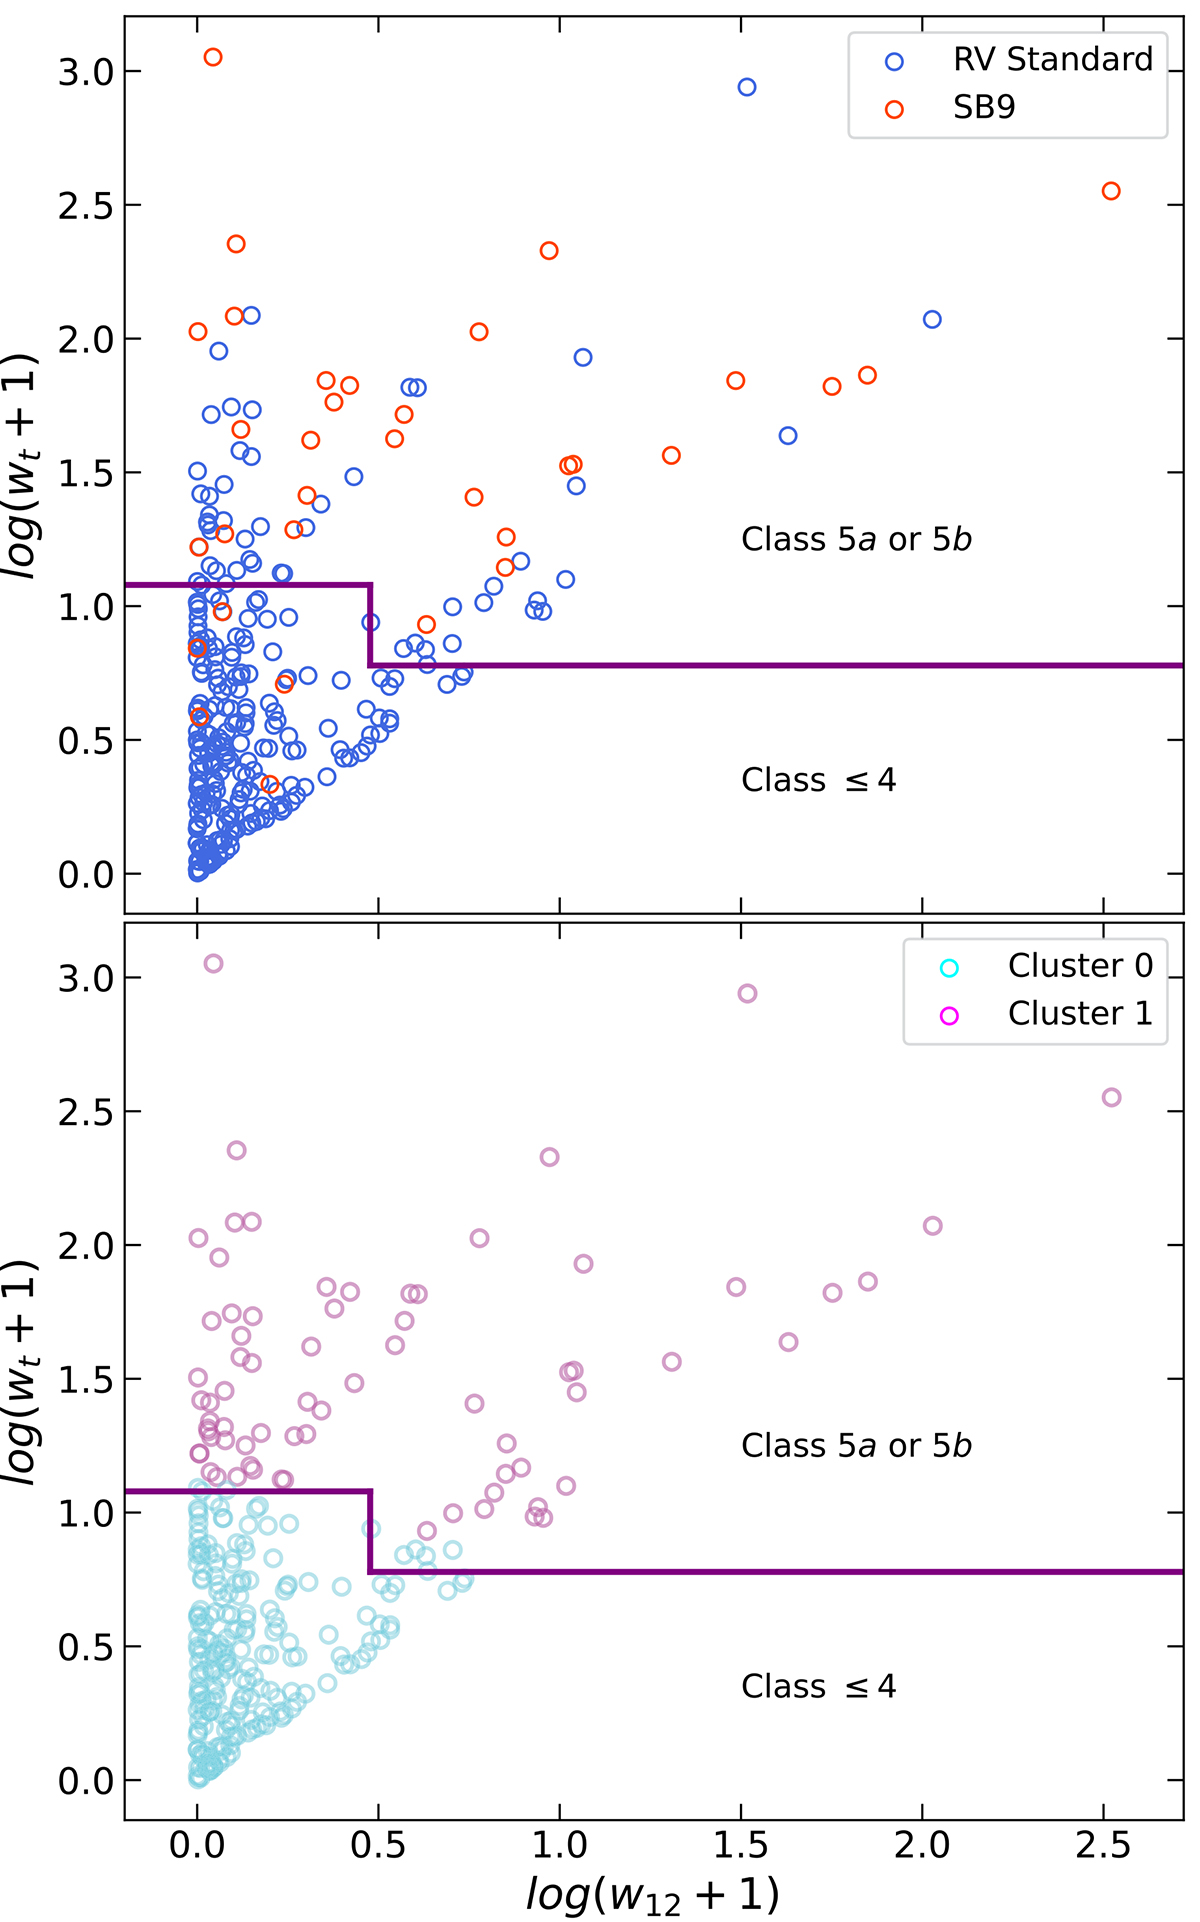
Fig. 3.
Download original image
The top panel shows the wt-w12 logarithmic distribution obtained for SB9 (orange) and RV-standard star (blue) subsets with Gaia DR3, RAVE DR6 measurements, and one measurement obtained directly from SB9 or the RV standard stars catalog of Soubiran et al. (2018). The bottom panel shows the wt-w12 logarithmic distribution for the same subsets shown in the top panel, but colored according to the cluster that the K-means algorithm decided they belonged to (i.e., cyan for stars in Cluster 0 and magenta for those in Cluster 1). For both panels, we added a purple line that indicates the separation between class ≤4 and class 5a-b according to our classification based on the w values.
Current usage metrics show cumulative count of Article Views (full-text article views including HTML views, PDF and ePub downloads, according to the available data) and Abstracts Views on Vision4Press platform.
Data correspond to usage on the plateform after 2015. The current usage metrics is available 48-96 hours after online publication and is updated daily on week days.
Initial download of the metrics may take a while.