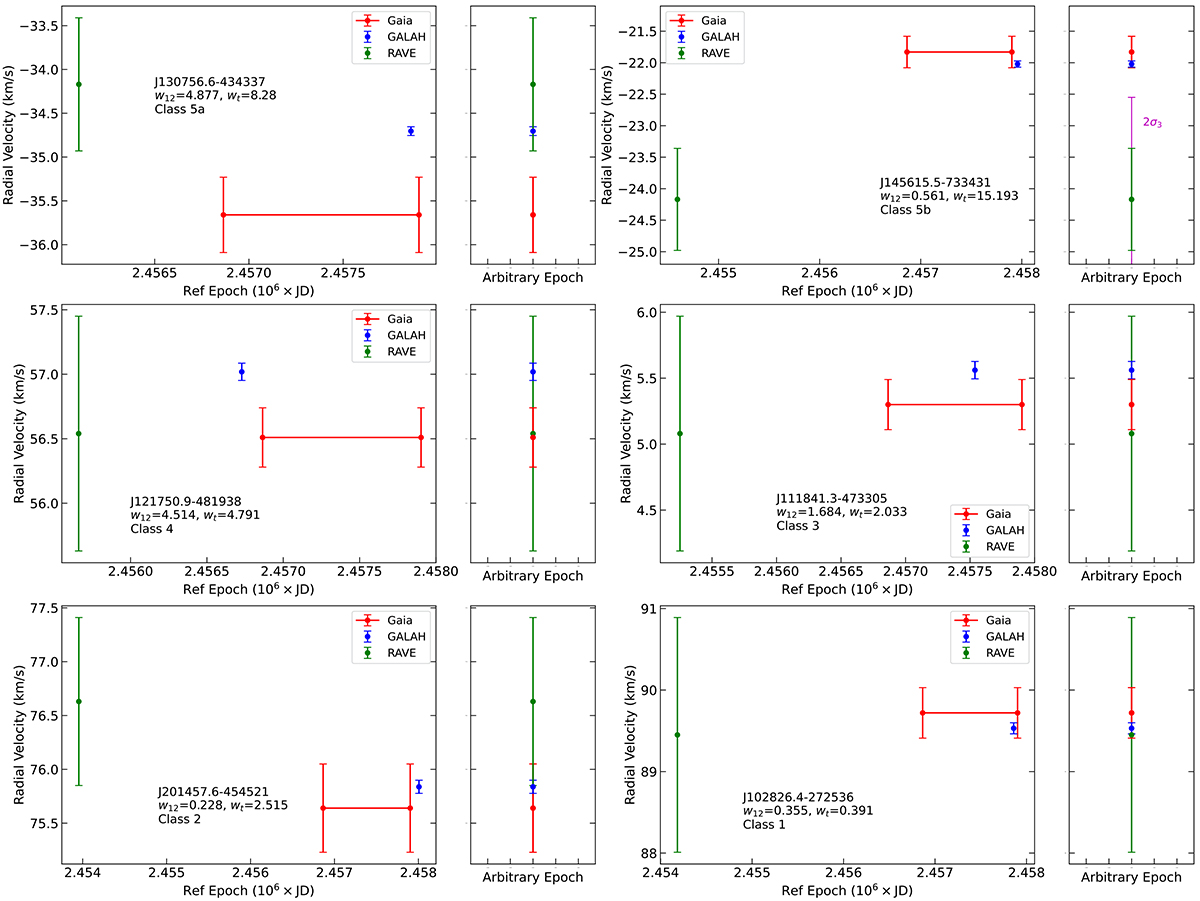
Fig. 1.
Download original image
Each panel shows, for a star in each of the classes in Table 1, the series of RV epochs used to determine the degree of RV variability of such a star (Gaia DR3 in red, GALAH DR3 in blue, and RAVE DR6 in green). The left-hand panels show the time series including their RVs, reference epochs, target name, w12 value, wt value, and the class assigned. For the Gaia DR3 case, the value reported is the mean value of measurements from 25 July 2014 to 28 May 2017, which is the total period of time of the data processed for the data release 3 (De Bruijne et al. 2022), and they are represented in the panels as a horizontal bar covering the time range. The right-hand panels show the three RV for an arbitrary epoch so that we can note how the error bars among the measurements are related for each class.
Current usage metrics show cumulative count of Article Views (full-text article views including HTML views, PDF and ePub downloads, according to the available data) and Abstracts Views on Vision4Press platform.
Data correspond to usage on the plateform after 2015. The current usage metrics is available 48-96 hours after online publication and is updated daily on week days.
Initial download of the metrics may take a while.