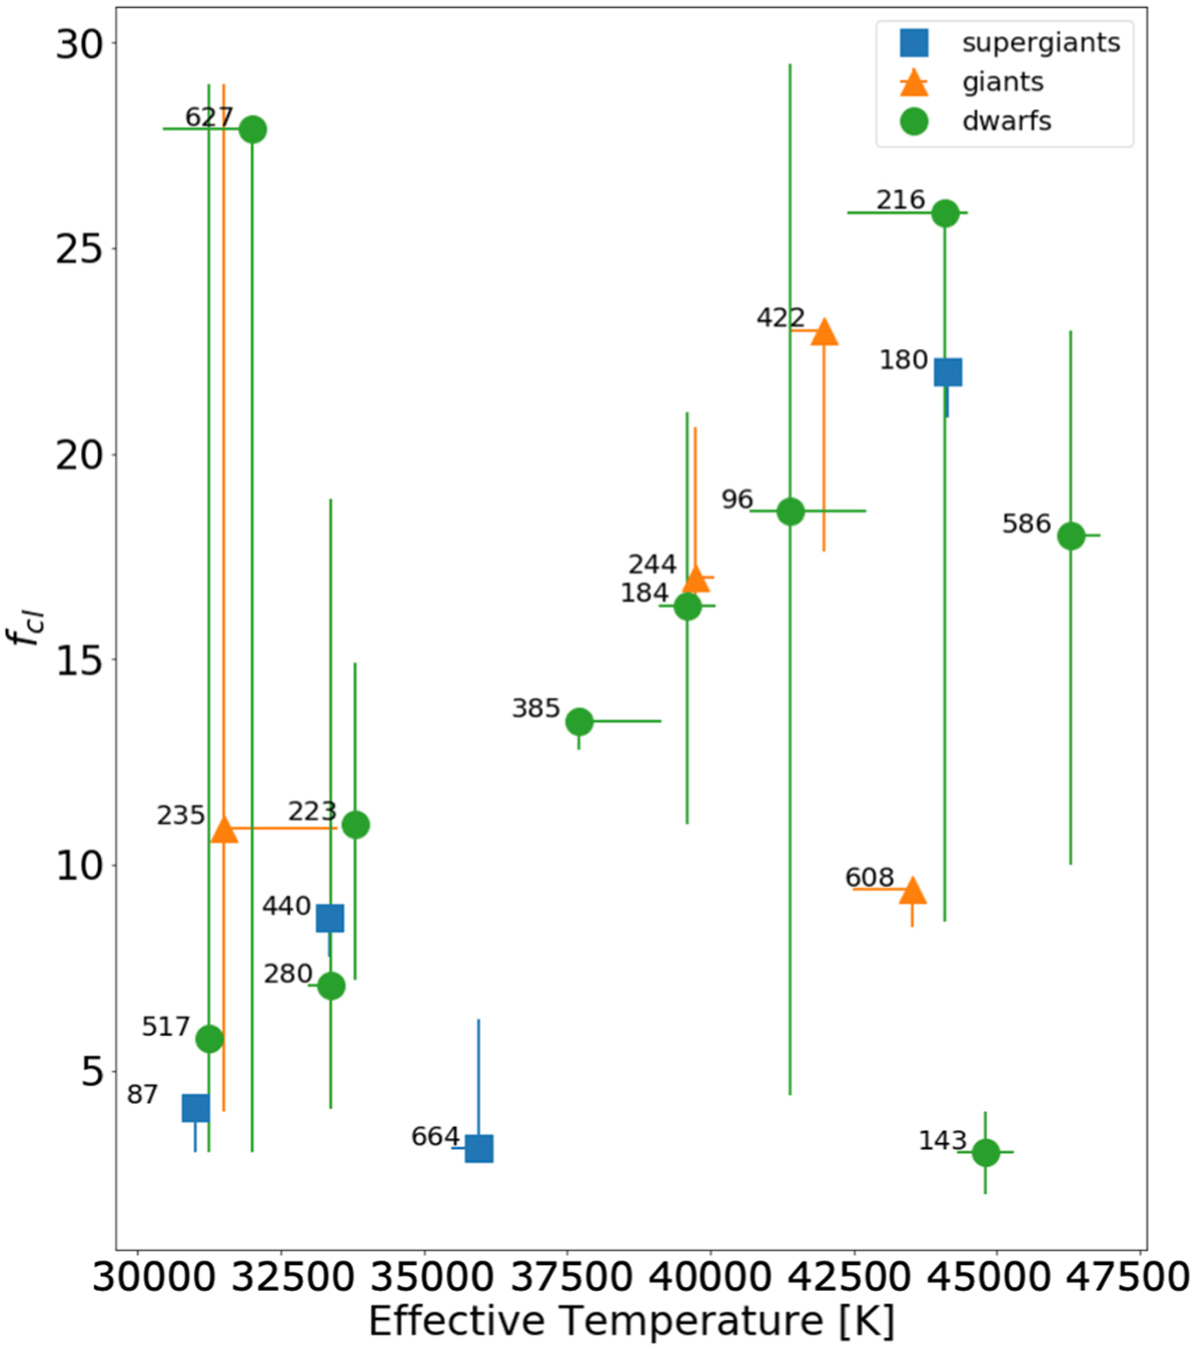
Fig. 4

Download original image
Best-fit clumping factors from the GA, with ƒcl for supergiants shown by blue squares, orange triangles for giants, and green circles for dwarfs. We find weighted average values of ƒcl = 16 ± 1 and ƒcl = 7 ± 1 above and below 38 kK, respectively, with an overall average ƒcl = 11 ± 1 . For weak-wind stars, there are little to no wind signatures in the spectrum, and so ƒcl cannot be reliably determined with the current method.
Current usage metrics show cumulative count of Article Views (full-text article views including HTML views, PDF and ePub downloads, according to the available data) and Abstracts Views on Vision4Press platform.
Data correspond to usage on the plateform after 2015. The current usage metrics is available 48-96 hours after online publication and is updated daily on week days.
Initial download of the metrics may take a while.


