Fig. 5.
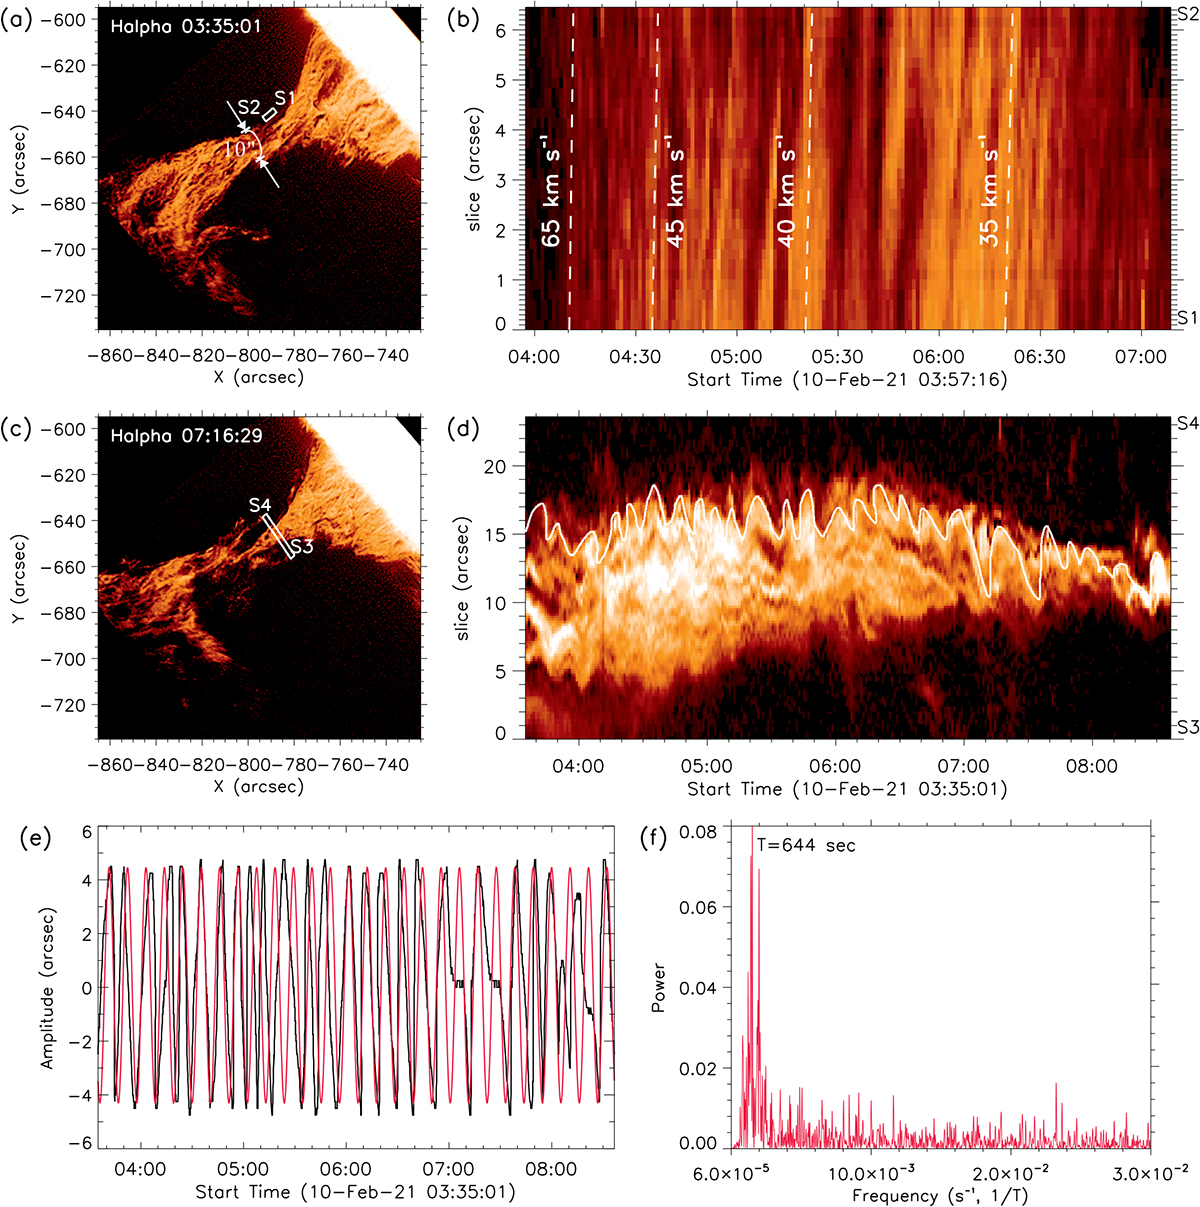
Download original image
Outflow speeds and dominant oscillation of the prominence calculated based on the time-slice Hα intensity distributions. Panels (a) and (c) show the rectangle slices “S1S2” and “S3S4” in the Hα images at 03:35 UT and 07:16 UT, respectively. Panels (b) and (d) present the corresponding time-slice intensity distributions from “S1” to “S2” and from “S3” to “S4”, with time represented on the X-axis and distances on the Y-axis. The dashed lines in Panel (b) indicate the linear fitting of the outflows. In Panel (d), the white curve highlights a notable oscillation along the “S3-S4” line. This oscillation is depicted by the black curve in Panel (e), which is obtained by subtracting the smoothed intensity with a width of 91. The red curve in Panel (e) represents the fitting curve computed using the Lomb-Scargle periodogram. Panel (f) displays the fitting frequency and power, indicating a dominant period of 644 seconds.
Current usage metrics show cumulative count of Article Views (full-text article views including HTML views, PDF and ePub downloads, according to the available data) and Abstracts Views on Vision4Press platform.
Data correspond to usage on the plateform after 2015. The current usage metrics is available 48-96 hours after online publication and is updated daily on week days.
Initial download of the metrics may take a while.