Fig. 6
Download original image
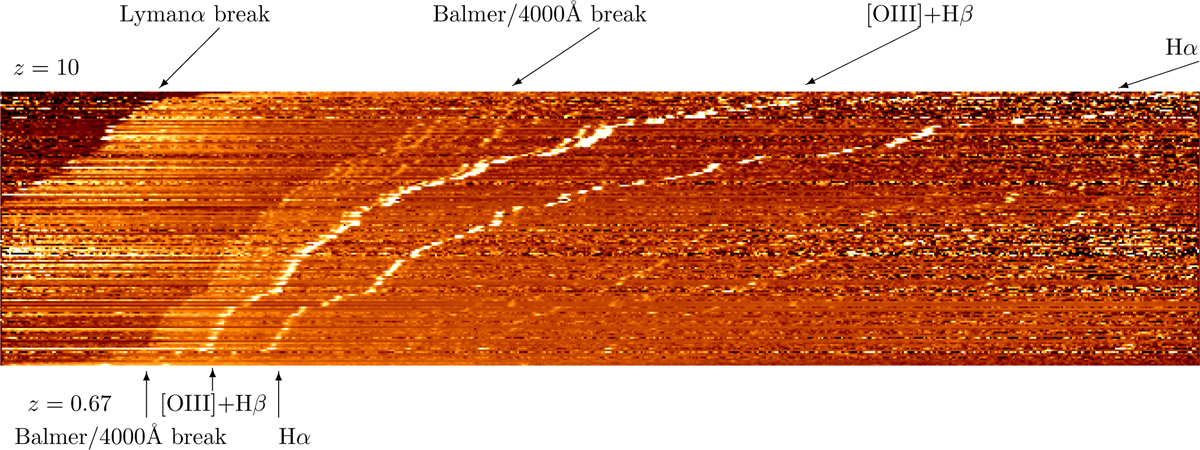
Extracted 1D NIRSpec prism spectra of galaxies with good redshifts in the GOODS-South/HUDF field, ordered by redshift (with highest redshifts at the top). Each spectrum is plotted in flux units of fλλ1.5 (i.e. a galaxy with a spectral slope of β = −1.5 will have constant brightness with wavelength in this plot) and normalised by the mean intensity at 2.3 < λ < 4.45 μm. Wavelength increases to the right, from 0.6–5.3 μm. The Lyman-α break and Balmer/4000 Å break are clearly visible, as are the prominent emission lines Hα and the Hβ+[OIII] 4959,5007 complex (which is blended at low redshift but resolved at higher redshift).
Current usage metrics show cumulative count of Article Views (full-text article views including HTML views, PDF and ePub downloads, according to the available data) and Abstracts Views on Vision4Press platform.
Data correspond to usage on the plateform after 2015. The current usage metrics is available 48-96 hours after online publication and is updated daily on week days.
Initial download of the metrics may take a while.