Fig. 5
Download original image
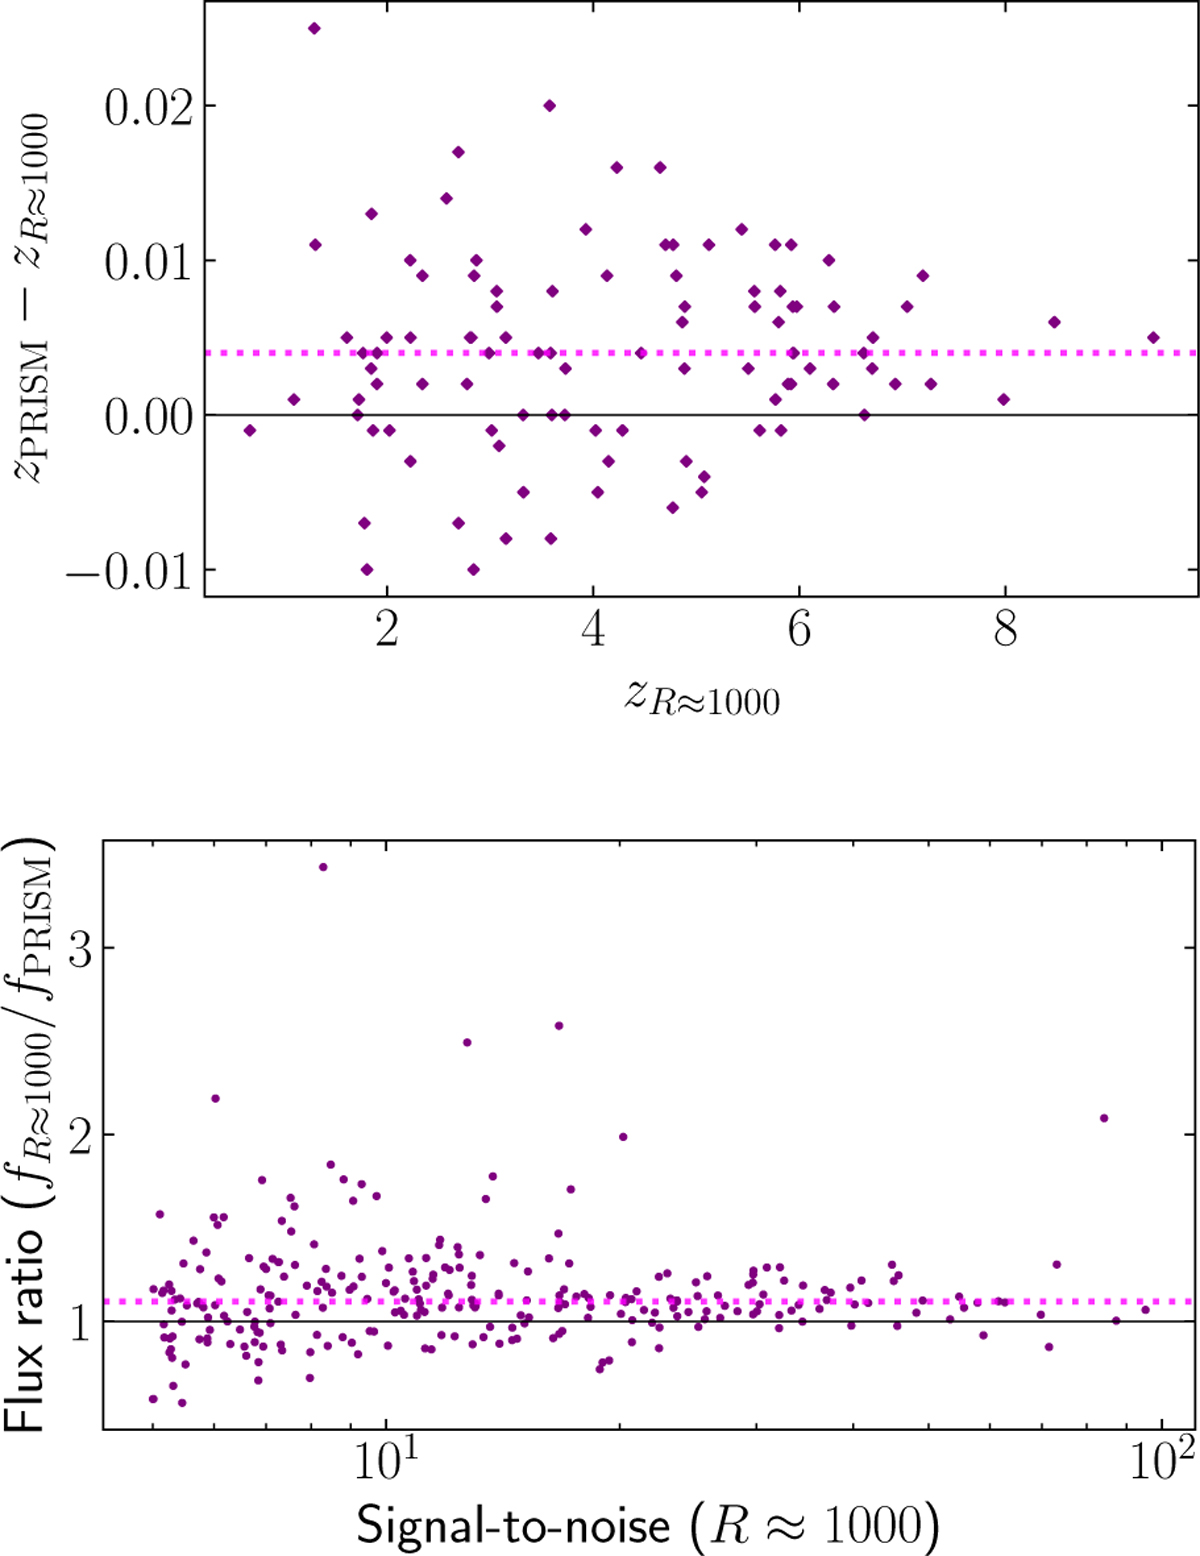
Comparison of spectral measurements between the low-dispersion prism and medium-dispersion gratings. Upper: comparison of redshift as determined from Prism/Clear and R ≈ 1000 grating observations for targets with emission lines clearly detected in both modes. There is a systematic offset of Δz = 0.0039, with the prism yielding systematically higher redshifts. Lower: comparison of emission lines fluxes measured from prism and R ≈ 1000 grating. Measurements derived from the grating are systematically higher with a median value of fR≈1000/fprism = 1.105 and a standard deviation of 0.298.
Current usage metrics show cumulative count of Article Views (full-text article views including HTML views, PDF and ePub downloads, according to the available data) and Abstracts Views on Vision4Press platform.
Data correspond to usage on the plateform after 2015. The current usage metrics is available 48-96 hours after online publication and is updated daily on week days.
Initial download of the metrics may take a while.