Fig. 4
Download original image
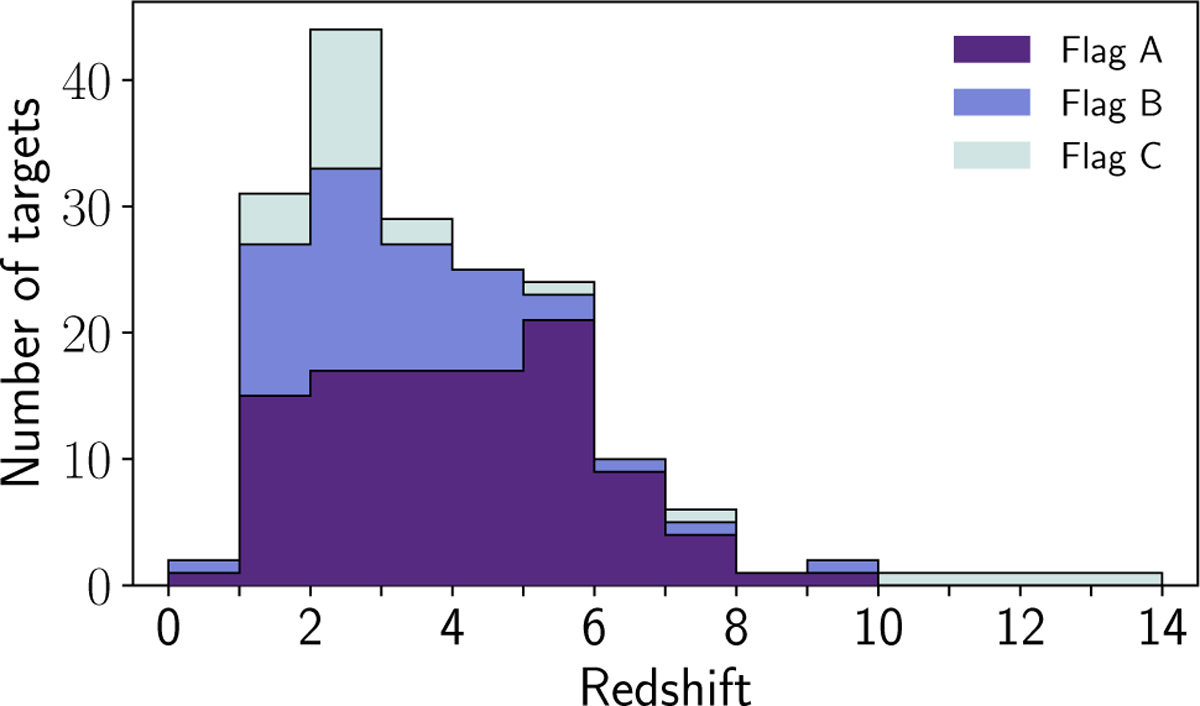
Histogram of spectroscopic redshifts obtained from S/N > 5 emission lines. The separate histograms are for the medium-dispersion R ≈ 1000 gratings (flag A, darkest purple), additional galaxies with S/N > 5 emission lines detected with the low-dispersion R ≈ 30–300 prism (flag B, lighter purple histogram) and galaxies with more marginal redshifts (flag C, lightest histogram).
Current usage metrics show cumulative count of Article Views (full-text article views including HTML views, PDF and ePub downloads, according to the available data) and Abstracts Views on Vision4Press platform.
Data correspond to usage on the plateform after 2015. The current usage metrics is available 48-96 hours after online publication and is updated daily on week days.
Initial download of the metrics may take a while.