Open Access
Fig. E.1
Download original image
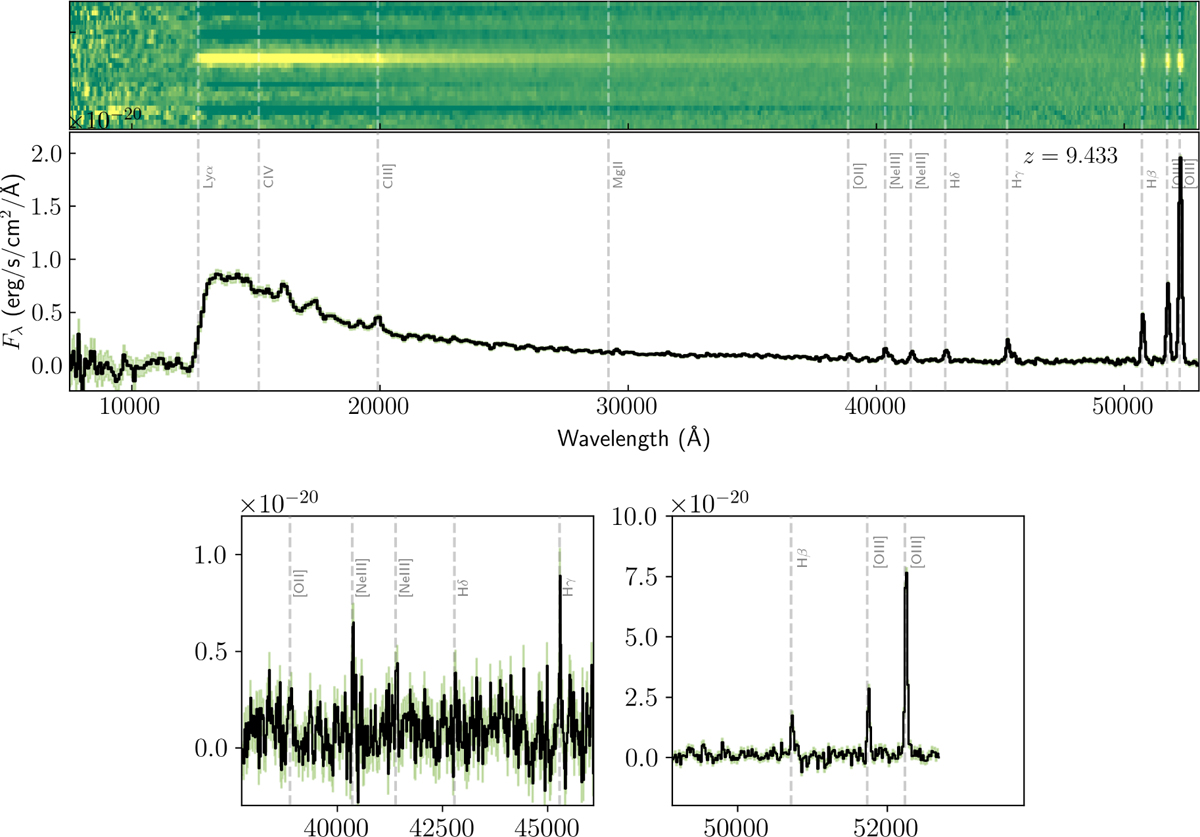
Low-dispersion prism spectra (1D and 2D) of 10058975 at z = 9.4327, with the medium dispersion grating of prominent lines shown below. Green shaded regions on the 1D spectra denote the 1σ errors. The wavelengths of common emission lines are denoted by vertical lines.
Current usage metrics show cumulative count of Article Views (full-text article views including HTML views, PDF and ePub downloads, according to the available data) and Abstracts Views on Vision4Press platform.
Data correspond to usage on the plateform after 2015. The current usage metrics is available 48-96 hours after online publication and is updated daily on week days.
Initial download of the metrics may take a while.