| Issue |
A&A
Volume 689, September 2024
|
|
|---|---|---|
| Article Number | L6 | |
| Number of page(s) | 5 | |
| Section | Letters to the Editor | |
| DOI | https://doi.org/10.1051/0004-6361/202451635 | |
| Published online | 11 September 2024 | |
Letter to the Editor
Ultraviolet spectroscopy of the supernova Ia hypervelocity runaway white dwarf J0927−6335
1
Institut für Astronomie und Astrophysik, Kepler Center for Astro and Particle Physics, Eberhard Karls Universität, Sand 1, 72076 Tübingen, Germany
2
Department of Astronomy, California Institute of Technology, 1200 East California Boulevard, Pasadena, CA 91125, USA
3
Department of Physics, University of Warwick, Coventry CV4 7AL, UK
4
Department of Astronomy and Theoretical Astrophysics Center, University of California, Berkeley CA, USA
Received:
23
July
2024
Accepted:
15
August
2024
Abstract
The hot white dwarf (WD) J0927−6335 (Gaia DR3 5250394728194220800 with an effective temperature of Teff = 60 000 K and a surface gravity of logg = 7) was detected as the fastest known Galactic hypervelocity star with a space velocity of ≈2800 km s−1 and an atmosphere dominated by carbon and oxygen. It is thought to be the surviving WD donor predicted by the so-called dynamically driven double-degenerate double-detonation (D6) type Ia supernova formation model. We analysed an ultraviolet spectrum of J0927−6335 that was recently obtained with the Hubble Space Telescope and found very high abundances of iron and nickel. This might originate in the pollution of the remnant by the supernova Ia explosion, but it is uncertain to which extent atomic diffusion altered the chemical composition of the accreted material.
Key words: stars: atmospheres / binaries: close / stars: chemically peculiar / stars: evolution / stars: individual: J0927–6335 / white dwarfs
Corresponding author; This email address is being protected from spambots. You need JavaScript enabled to view it.
© The Authors 2024
 Open Access article, published by EDP Sciences, under the terms of the Creative Commons Attribution License (https://creativecommons.org/licenses/by/4.0), which permits unrestricted use, distribution, and reproduction in any medium, provided the original work is properly cited.
This article is published in open access under the Subscribe to Open model. This email address is being protected from spambots. You need JavaScript enabled to view it. to support open access publication.
1. Introduction
A population of hypervelocity white dwarfs (WDs) launched from thermonuclear supernovae (SNe) in close WD binaries was identified by Shen et al. (2018a) through Gaia astrometry. Additional objects like this were found by El-Badry et al. (2023). Unlike the cool and bloated objects discovered by Shen et al. (2018a), several of the sources identified by El-Badry et al. (2023) are hot, with Teff ≳ 60 000 K. One of them is J0927−6335 (Gaia DR3 5250394728194220800), the fastest known star in the Galaxy, with a space velocity of ≈2800 km s−1. From an analysis of the optical spectrum, an effective temperature and a surface gravity of Teff = 60 000 ± 5000 K and logg = 7.0 ± 0.5 were found (Werner et al. 2024). Only the lines of carbon and oxygen were identified (ionisation stages CIII-IV and OIII-IV), and it was inferred that the atmosphere is composed of carbon and oxygen in equal amounts (by mass). An upper limit of the helium abundance was derived (He < 0.05). It was concluded that J0927−6335 is a runaway WD that was eroded by the accretor both prior to and during its explosion. J0927−6335 and other similar hypervelocity WDs were designated dynamically driven double-degenerate double-detonation (D6) stars after the formation model of this name (Shen et al. 2018a). It is expected that the surviving WD is polluted by the explosion debris from the companion, which is predicted to consist mostly of iron-group elements (e.g., Keegans et al. 2023). Because of the high effective temperature, however, heavy metals can only be detected in ultraviolet (UV) spectra.
We therefore observed J0927−6335 with the Hubble Space Telescope (HST) and conducted a model-atmosphere analysis in order to test the D6 formation scenario for hypervelocity WDs. Abundance measurements may constrain the yields of the SNe from which these stars were born and the masses of the exploded WDs. This might help us to shed light on the debated physics and origin of type Ia SNe (e.g., Liu et al. 2023; Shen et al. 2024).
2. Observation
J0927−6335 was observed with the Cosmic Origins Spectrograph (COS) on board the HST on April 9, 2024 (proposal ID 17441, PI El-Badry). Grating G140L with a spectral resolution of Δλ = 0.6 Å was used, and the central wavelength was set to 1105 Å. The spectrum covers the wavelength range ≈1120 − 2250 Å, but the strongly decreasing signal-to-noise ratio (S/N) towards the red end limits the useful range to about 1940 Å. The spectrum was smoothed with a 0.2 Å wide boxcar to increase the S/N without significant loss of spectral resolution. We cut out strong airglow lines from H I Lyα at 1216 Å and O I near 1305 Å. The spectrum is displayed in Fig. 1. It was shifted to rest wavelengths accounting for the radial velocity of the star (vrad = −2285 km s−1) as determined by El-Badry et al. (2023) based on higher-resolution optical spectroscopy. We also tried to directly measure the stellar radial velocity from the UV spectrum and found vrad = −2265 ± 20 km s−1, which is fully consistent with the value inferred from the optical spectra.
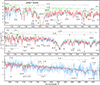 |
Fig. 1. HST spectrum of J0927−6335 (blue graph) shifted to rest wavelengths and compared to our final model (red graph) with Teff = 60 000 K, logg = 7.0, C = 0.42, N = 0.0007, O = 0.42, Si = 0.02, Fe = 0.10, and Ni = 0.03 (mass fractions). The spectrum is dominated by strong C III/C IV lines and weaker O III/O IV lines and O V 1371 Å. The absorption feature at 1640 Å is not caused by He II, but by C IV. The continuum flux distribution is strongly affected by a curtain of numerous overlapping Fe and Ni lines, as can be judged from the dashed green graph, which is the same model but without Fe and Ni line opacities. Only a few of the strongest multiplets of Fe V, Ni IV, and Ni V are identified individually. Labels “is.” denote interstellar absorption lines. They are also included in the model spectrum. |
3. Spectral analysis
We used the Tübingen Model-Atmosphere Package (TMAP) to compute non-local thermodynamic equilibrium (NLTE), plane-parallel, line-blanketed atmosphere models in radiative and hydrostatic equilibrium (Werner et al. 2003). The chemical constituents of the initial model, which was constructed to match the optical spectrum of J0927−6335, are helium, carbon, and oxygen (see Werner et al. 2024 for details). For our current analysis of the UV spectrum, a new set of models was computed that additionally included iron and nickel. In order to account for the large number of iron and nickel lines, we employed a statistical approach (using so-called superlevels and superlines) that enables the construction of models under NLTE conditions (Anderson 1989; Dreizler & Werner 1993; Rauch & Deetjen 2003). In essence, we included lines from Kurucz’s lists (Kurucz 2009) for FeIV-VII and NiIV-VII. These so-called LIN lists comprise 7,561,008 and 16,882,369 lines in total with laboratory-observed and computed wavelengths from iron and nickel, respectively, in the considered ionisation stages. The synthetic spectra that were compared to the observation were computed with the so-called POS lists, which are a subset of the LIN lists that only contain laboratory-observed lines. Subsequent NLTE line formation iterations (in which the atmospheric structure was kept fixed) were carried out for nitrogen, silicon, sulfur, chromium, and manganese. The latter two were numerically treated like iron and nickel. Table 1 summarises the model atoms we used. In order to reduce computational time, model atoms smaller than listed in the table were used for some ions when we calculated the atmospheric structure. These are C III (44 NLTE levels, 175 lines), O III (1, 0), O IV (38, 173), and O V (34, 114).
Atmospheric element abundances of J0927−6335 and statistics of NLTE model atoms.
We started the analysis of the HST spectrum by extending the synthetic spectrum from the final model of our optical analysis to the UV. This helped us to identify the strongest observed lines, which stem from carbon and oxygen. Like in the optical spectrum, these are lines from C III and C IV (with the 1548/1551 Å resonance line as the most prominent in the entire spectrum), O III, and O IV. In contrast to the optical spectrum, we can also detect a O V line, namely the line at 1371 Å (but it is blended with a strong Fe V line). The relative strength of the oxygen lines from all three ionisation stages is well reproduced by the model, indicating that the effective temperature of the model (Teff = 60 000 K) correctly predicts the ionisation balance. The same holds for the relative strengths of the carbon lines from both ionisation stages. The absolute strengths of the carbon and oxygen lines also match well, indicating that the carbon and oxygen abundances are similar, as found from the optical spectrum. The broad wings of C IV 1548/1551 Å are well reproduced by the model, showing that the surface gravity found from the optical line analysis (logg=7) is correct. For the following analysis steps, we therefore kept Teff = 60 000 K, logg = 7, and C/O = 1 fixed.
We reddened our models by using the color excess E(B − V)=0.15, found by a fit to the spectral energy distribution of J0927−6335 (Werner et al. 2024), and assuming a Fitzpatrick (1999) reddening law with Rv = 3.1. The same value for the reddening was adopted by El-Badry et al. (2023), considering the predicted values of 0.13 and 0.2 for infinity from the Lallement et al. (2022) 3D dust map and the Schlegel et al. (1998) dust map, respectively. Using the relation log(NH/E(B − V)) = 21.58 (Groenewegen & Lamers 1989), we obtained the interstellar neutral hydrogen column density nH = 5.7 × 1020 cm−2. With this value, our models are attenuated by the resulting broad interstellar Lyman α line. It does not appear to be centred at its rest wavelength at 1216 Å in Fig. 1, but redward at about 1225 Å because we shifted the stellar spectrum to rest wavelengths. We identified a few other commonly occurring interstellar lines that we also modelled in the synthetic spectrum by freely customising the ion column densities. They are indicated in Fig. 1. We found no clear indications for the presence of interstellar resonance line doublets of C IV, N V, and Si IV, but strong photospheric metal line blanketing might preclude their detection.
The absorption feature at 1640 Å is not caused by photospheric helium, but by carbon. We see a blend of some components of a C IV transition between atomic levels with principal quantum numbers n = 4 → 6 of this lithium-like ion, instead of the n = 2 → 3 in the isoelectronic He II ion. The situation is similar to that in the optical region, where C IVn = 6 → 8 transitions mimic a He IIn = 3 → 4 line at 4686 Å. The HST spectrum therefore confirms the helium-deficiency of J0927−6335 (see below).
Except for the good representation of the carbon and oxygen lines, however, the original C/O model of the optical analysis of Werner et al. (2024) did not match the UV continuum flux distribution. It significantly overpredicts the flux of the COS spectrum in the short-wavelength region up to about 1640 Å. This cannot be solved by stronger reddening. Increasing E(B − V) from 0.15 to 0.2 would help only at the shortest wavelengths of the spectrum. In addition, the observed overall flux distribution shows structures that indicate additional line opacity sources. This situation is reminiscent of a similar situation in the UV spectra of some hot subdwarf stars, where heavy line blanketing by overabundant iron-group elements was found, for instance, in the hydrogen-rich sdO star EC 11481–2303 (Teff = 55 000, logg = 5.8, Ringat & Rauch 2012; Landstorfer et al. 2024). The heavy-element excess in hot subdwarfs is the consequence of atomic diffusion driven by selective radiative levitation.
Iron and nickel have a large number of lines in the UV spectra of hot stars. Given the moderate resolution of the HST/COS spectrum of J0927−6335, only the strongest lines can be identified individually. They stem from Fe V and NiIV-V, and some of them are marked in Fig. 1. The majority of the lines of the iron and nickel in ionisation stages IV–VI with weaker opacity, however, effectively suppress the continuum flux, especially when the element abundances are high. A comparison of our final model with a synthetic spectrum from which we removed all iron and nickel lines shows that line blanketing in the short-wavelength region up to about 1600 Å is so severe that there are only a few narrow windows with no or very weak lines in which we see the true continuum. One example can be seen just blueward of the O V 1371 Å line in the region 1365–1370 Å (top panel of Fig. 1), which at first glance looks like an emission feature. The flux on the red side of the O V line core is strongly absorbed by a forest of many strong Fe V lines.
By switching off lines from single ions in the synthetic spectrum, we found that different ions of iron and nickel block the flux in different but overlapping wavelength regions. With increasing ionisation stage, the lines generally appear at shorter wavelengths and the contribution of nickel to the opacity is stronger than that of iron. In Table 2 we indicate the wavelength region in which we find the strongest contribution of relevant iron and nickel ions.
Approximate spectral regions in which the Fe and Ni lines are predominantly located.
We calculated about a dozen models with various iron and nickel abundances and selected the best-fitting model by eye. We estimated the errors by excluding models that showed significantly worse fits. The final model has Fe = 0.10 ± 0.05 and Ni = 0.03 ± 0.02. The error limits are quite large because it is difficult to disentangle the contributions of iron and nickel to the spectral energy distribution. To some extent, a higher abundance of one element can be compensated for by a lower abundance of the other. However, Fig. 2 shows a spectral region in which the complete lack of nickel cannot be compensated for even when iron is increased to Fe = 0.30, that is, a factor of three higher than in our best-fit model.
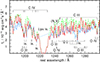 |
Fig. 2. Similar to Fig. 1. The final model (red graph) with Fe = 0.10 and Ni = 0.03 is compared to a model with Fe = 0.30 and Ni = 0 (dashed green graph). |
The only other species in addition to C, O, Fe, and Ni that we identified are silicon and perhaps sulfur. It is possible to recognise the resonance doublet of Si IV at 1394/1403 Å, although it is located in a wavelength region in which the strongest Fe V multiplets are found. Model fits with various silicon abundances arrive at Si = 0.02 ± 0.01. A few other Si IV lines are visible in our model, and they are labelled in Fig. 1. However, they are weaker than the resonance doublet and cannot be identified in the observation. We can constrain the abundance of sulfur using the strongest S V line, which is located at 1501.76 Å. Unfortunately, it is blended by an unidentified line located redward by about 0.5 Å. By varying the sulfur abundance, we find an good fit at S = 0.005, but we regard this value as just an upper limit. A S V multiplet is located at 1128–1134 Å, but its strongest components are blended by dominating Si IV lines. A doublet of S VI is at 1420/1424 Å but it is also blended by other lines. At least we can use it to confirm that S < 0.005.
We place upper abundance limits to a few other species. For nitrogen, we used the absence of the N V 1239/43 resonance doublet and the N IV 1719 Å line. We find N < 7 × 10⁻⁴, which is the solar mass fraction (Asplund et al. 2009). We also confirmed the upper limit of the helium abundance (He < 0.05) found previously from the optical spectrum. At higher abundances, a He II line core at 1640 Å appears in the models, in contrast to the observation. We also determined upper abundance limits for the iron-group elements chromium and manganese. For both species, a small number of the strongest predicted lines (Cr V, Cr VI, Mn V, Mn VI) were used for this purpose. We find Cr < 0.01 and Mn < 0.003. Table 1 summarises our abundance analysis.
Some absorption features in the HST spectrum are not reproduced by our model, and we are unable to identify them (see e.g. at 1573 Å). At longer wavelengths (bottom panel of Fig. 1) lie more unidentified absorptions, for example, at 1670 Å. They might be spurious features caused by the low S/N, but on the other hand, a similar strong feature at 1921 Å is a C III line that the model matches closely. Some unidentified lines could stem from O III. They are located near 1760–1790 Å, 1850–1875 Å, and 1920–1925 Å, and we marked them with the label “O III?” in Fig. 1. These lines appear in the atomic spectra database1 of the National Institute for Standards and Technologies (NIST, Ralchenko & Kramida 2020) and were first reported as strong lines in laboratory spectra by Bockasten et al. (1964). They are particular lines because intermediate coupling is significant for the upper levels that are involved. This is probably one reason why no oscillator strengths were computed, and we therefore cannot model these lines.
4. Summary and discussion
We found that the carbon- and oxygen-dominated atmosphere of J0927−6335 (C/O = 1) is strongly enriched in iron and nickel, namely, Fe = 0.10 ± 0.05 and Ni = 0.03 ± 0.02. We can interpret this composition as a mixture of C and O of the escaping CO WD and deposited SN ejecta from the exploded WD. The absolute abundances of Fe and Ni depend on the mixing of the contaminants in the C/O envelope. We can compare the observed Ni/Fe ratio (0.067–1.0) to model predictions for sub-Chandraskhar explosions which depend on the WD mass M and metallicity Z. For solar-like metallicities and depending on the WD mass, the Ni/Fe ratio is between about 0.003–0.06 (Shen et al. 2018b). The predictions are smaller than the value we found for J0927−6335, but the lower limit of our result is marginally consistent with the prediction for a Z = 2 and an M = 1.1 M⊙ WD.
Iron and nickel abundances determined from X-ray spectroscopy of two evolved Ia supernova remnants (SNRs) resulted in Ni/Fe ratios that are compatible with the mentioned predictions of sub-Chandrasekhar explosions (Yamaguchi et al. 2015; Shen et al. 2018b). For the Kepler and Tycho SNRs, Ni/Fe = 0.03–0.07 and 0.02–0.04 were found, respectively (Park et al. 2013; Yamaguchi et al. 2014, 2015), which indicates Z ≈ 2 and M ≈ 1 M⊙ WD progenitors. A significantly higher ratio (Ni/Fe = 0.11–0.24) that is closer to the value we measured for J0927−6335 was found for the SNR 3C 397 (Yamaguchi et al. 2015). This high value would require an unrealistically high initial metallicity for a sub-Chandrasekhar SN and thus was claimed as evidence for a Chandrasekhar-mass explosion, that is, a single-degenerate (SD) origin of 3C 397. Shen et al. (2018b) argued, however, that the SD scenario cannot explain the high Ni/Fe ratio either. The authors concluded that this object continues to present a nucleosynthetic puzzle for any SN type Ia scenario. In this sense, the WD of our study represents another such puzzle piece.
We briefly mentioned the sdO star EC11481−2302, in which the strong enrichment in Fe and Ni is caused by radiative levitation. The question therefore arises whether this process is relevant for J0927−6335 as well. In Table 3 we compare the element abundances of these two stars and a DA and a DO WD with similar temperature and gravity as J0927−6335. Only the sdO star shows an extreme Fe and Ni enrichment similar to that of J0927−6335, but its surface gravity is much lower. Silicon is very much lower in the DA and in the DO. This might mean that gravitational settling and radiative levitation is not at work in J0927−6335. In contrast to H- and He-dominated objects, however, we do not know whether and how atomic diffusion acts on Si, Fe, and Ni in a CO-dominated atmosphere. Investigations of SN Iax remnant models by Zhang et al. (2019) predicted that the atmospheres are depleted of C and O and dominated by Fe and Ni because of radiative levitation (their Fig. 9), but the authors emphasised that this extreme effect is probably unrealistic due to their inaccurate numerical treatment of diffusion. In addition, they disregarded stellar winds, which hamper the effects of levitation and settling (Unglaub & Bues 2000). We are therefore left with the conclusion that the high abundances of Fe and Ni in J0927−6335 could signal the pollution of the remnant by the SN Ia explosion, but we are uncertain to which extent diffusion altered the chemical composition of the accreted material.
Element abundances in J0927−6335 compared to other compact objects.
Acknowledgments
This research is based on observations made with the NASA/ESA Hubble Space Telescope obtained from the Space Telescope Science Institute, which is operated by the Association of Universities for Research in Astronomy, Inc., under NASA contract NAS 5–26555. These observations are associated with program ID 17441. The TMAD tool (http://astro.uni-tuebingen.de/~TMAD) used for this paper was constructed as part of the activities of the German Astrophysical Virtual Observatory. This research has made use of NASA’s Astrophysics Data System and the SIMBAD database, operated at CDS, Strasbourg, France. This research has made use of the VizieR catalogue access tool, CDS, Strasbourg, France. K.E. was supported in part by HST-GO-17441.001-A. This project has received funding from the European Research Council (ERC) under the European Union’s Horizon 2020 research and innovation programme (Grant agreement No. 101020057).
References
- Anderson, L. S. 1989, ApJ, 339, 558 [Google Scholar]
- Asplund, M., Grevesse, N., Sauval, A. J., & Scott, P. 2009, ARA&A, 47, 481 [NASA ADS] [CrossRef] [Google Scholar]
- Bockasten, K., Hallin, R., Johansson, K. B., & Tsui, P. 1964, Phys. Lett., 8, 181 [NASA ADS] [CrossRef] [Google Scholar]
- Dreizler, S., & Werner, K. 1993, A&A, 278, 199 [Google Scholar]
- El-Badry, K., Shen, K. J., Chandra, V., et al. 2023, Open J. Astrophys., 6, 28 [CrossRef] [Google Scholar]
- Fitzpatrick, E. L. 1999, PASP, 111, 63 [Google Scholar]
- Groenewegen, M. A. T., & Lamers, H. J. G. L. M. 1989, A&AS, 79, 359 [Google Scholar]
- Keegans, J. D., Pignatari, M., Stancliffe, R. J., et al. 2023, ApJS, 268, 8 [NASA ADS] [CrossRef] [Google Scholar]
- Kurucz, R. L. 2009, Am. Inst. Phys. Conf. Ser., 1171, 43 [Google Scholar]
- Lallement, R., Vergely, J. L., Babusiaux, C., & Cox, N. L. J. 2022, A&A, 661, A147 [NASA ADS] [CrossRef] [EDP Sciences] [Google Scholar]
- Landstorfer, A., Rauch, T., & Werner, K. 2024, A&A, 688, A101 [NASA ADS] [CrossRef] [EDP Sciences] [Google Scholar]
- Liu, Z.-W., Röpke, F. K., & Han, Z. 2023, Res. Astron. Astrophys., 23, 082001 [CrossRef] [Google Scholar]
- Park, S., Badenes, C., Mori, K., et al. 2013, ApJ, 767, L10 [NASA ADS] [CrossRef] [Google Scholar]
- Ralchenko, Y., & Kramida, A. 2020, Atoms, 8, 56 [NASA ADS] [CrossRef] [Google Scholar]
- Rauch, T., & Deetjen, J. L. 2003, ASP Conf. Ser., 288, 103 [NASA ADS] [Google Scholar]
- Rauch, T., Werner, K., Bohlin, R., & Kruk, J. W. 2013, A&A, 560, A106 [NASA ADS] [CrossRef] [EDP Sciences] [Google Scholar]
- Ringat, E., & Rauch, T. 2012, ASP Conf. Ser., 452, 71 [Google Scholar]
- Schlegel, D. J., Finkbeiner, D. P., & Davis, M. 1998, ApJ, 500, 525 [Google Scholar]
- Shen, K. J., Boubert, D., Gänsicke, B. T., et al. 2018a, ApJ, 865, 15 [Google Scholar]
- Shen, K. J., Kasen, D., Miles, B. J., & Townsley, D. M. 2018b, ApJ, 854, 52 [Google Scholar]
- Shen, K. J., Boos, S. J., & Townsley, D. M. 2024, ArXiv e-prints [arXiv:2405.19417] [Google Scholar]
- Unglaub, K., & Bues, I. 2000, A&A, 359, 1042 [NASA ADS] [Google Scholar]
- Werner, K., Deetjen, J. L., Dreizler, S., et al. 2003, ASP Conf. Ser., 288, 31 [Google Scholar]
- Werner, K., Rauch, T., & Kruk, J. W. 2018, A&A, 609, A107 [NASA ADS] [CrossRef] [EDP Sciences] [Google Scholar]
- Werner, K., Reindl, N., Rauch, T., El-Badry, K., & Bédard, A. 2024, A&A, 682, A42 [NASA ADS] [CrossRef] [EDP Sciences] [Google Scholar]
- Yamaguchi, H., Eriksen, K. A., Badenes, C., et al. 2014, ApJ, 780, 136 [Google Scholar]
- Yamaguchi, H., Badenes, C., Foster, A. R., et al. 2015, ApJ, 801, L31 [CrossRef] [Google Scholar]
- Zhang, M., Fuller, J., Schwab, J., & Foley, R. J. 2019, ApJ, 872, 29 [Google Scholar]
All Tables
Atmospheric element abundances of J0927−6335 and statistics of NLTE model atoms.
Approximate spectral regions in which the Fe and Ni lines are predominantly located.
All Figures
|
Fig. 1. HST spectrum of J0927−6335 (blue graph) shifted to rest wavelengths and compared to our final model (red graph) with Teff = 60 000 K, logg = 7.0, C = 0.42, N = 0.0007, O = 0.42, Si = 0.02, Fe = 0.10, and Ni = 0.03 (mass fractions). The spectrum is dominated by strong C III/C IV lines and weaker O III/O IV lines and O V 1371 Å. The absorption feature at 1640 Å is not caused by He II, but by C IV. The continuum flux distribution is strongly affected by a curtain of numerous overlapping Fe and Ni lines, as can be judged from the dashed green graph, which is the same model but without Fe and Ni line opacities. Only a few of the strongest multiplets of Fe V, Ni IV, and Ni V are identified individually. Labels “is.” denote interstellar absorption lines. They are also included in the model spectrum. |
| In the text | |
|
Fig. 2. Similar to Fig. 1. The final model (red graph) with Fe = 0.10 and Ni = 0.03 is compared to a model with Fe = 0.30 and Ni = 0 (dashed green graph). |
| In the text | |
Current usage metrics show cumulative count of Article Views (full-text article views including HTML views, PDF and ePub downloads, according to the available data) and Abstracts Views on Vision4Press platform.
Data correspond to usage on the plateform after 2015. The current usage metrics is available 48-96 hours after online publication and is updated daily on week days.
Initial download of the metrics may take a while.