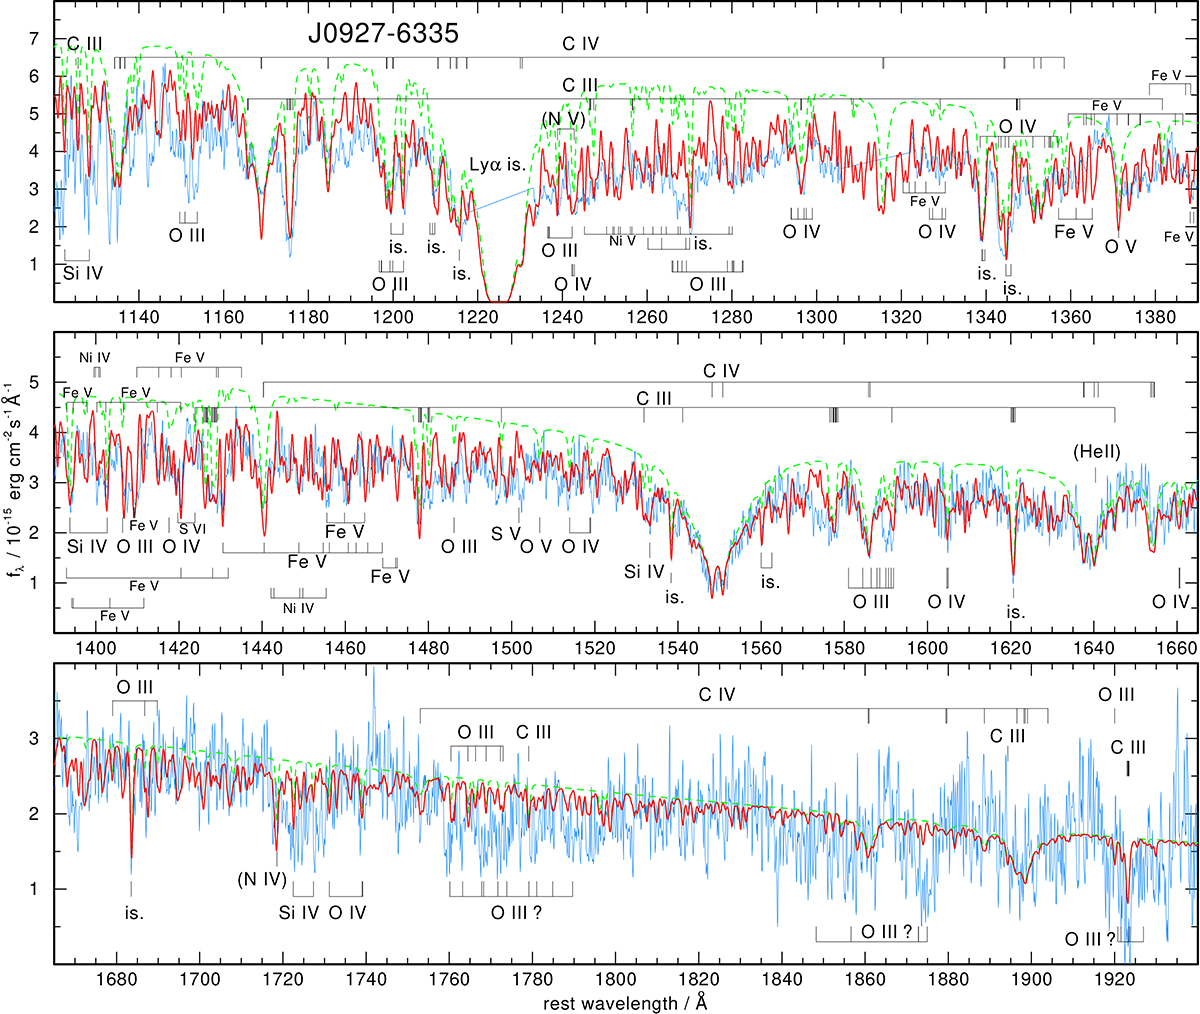
Fig. 1.
Download original image
HST spectrum of J0927−6335 (blue graph) shifted to rest wavelengths and compared to our final model (red graph) with Teff = 60 000 K, logg = 7.0, C = 0.42, N = 0.0007, O = 0.42, Si = 0.02, Fe = 0.10, and Ni = 0.03 (mass fractions). The spectrum is dominated by strong C III/C IV lines and weaker O III/O IV lines and O V 1371 Å. The absorption feature at 1640 Å is not caused by He II, but by C IV. The continuum flux distribution is strongly affected by a curtain of numerous overlapping Fe and Ni lines, as can be judged from the dashed green graph, which is the same model but without Fe and Ni line opacities. Only a few of the strongest multiplets of Fe V, Ni IV, and Ni V are identified individually. Labels “is.” denote interstellar absorption lines. They are also included in the model spectrum.
Current usage metrics show cumulative count of Article Views (full-text article views including HTML views, PDF and ePub downloads, according to the available data) and Abstracts Views on Vision4Press platform.
Data correspond to usage on the plateform after 2015. The current usage metrics is available 48-96 hours after online publication and is updated daily on week days.
Initial download of the metrics may take a while.