Fig. 5
Download original image
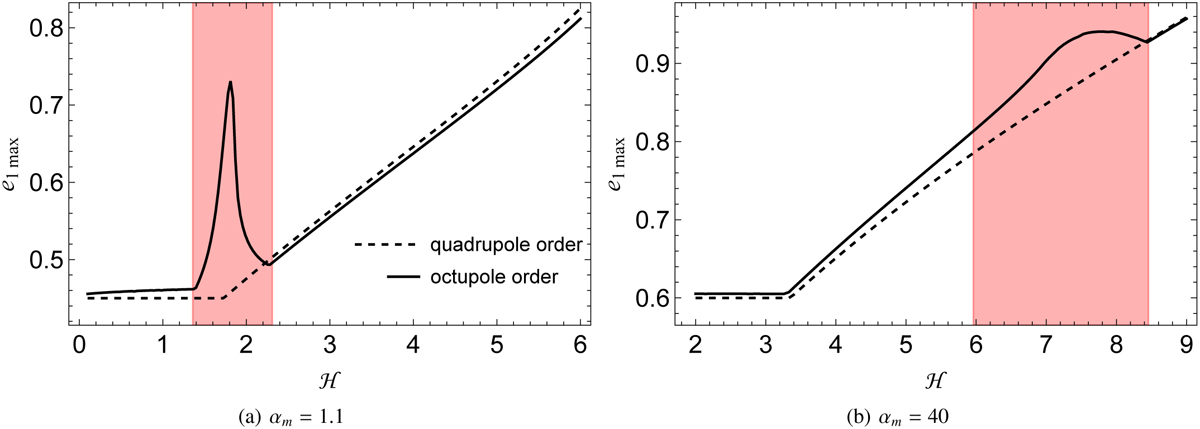
Maximum eccentricity reached by the trajectories is shown as a function of the Hamiltonian ℋ for the cases of αm = 1.1 (left panel) and αm = 40 (right panel). The solid lines represent the curves determined under the octupole-order model, while the dashed lines represent the curves determined under the quadrupole-order model. The initial eccentricities are assumed at 0.45 for αm = 1.1 and 0.6 for αm = 40. Under the octupole-order model, the peak of e1,max happens near the bifurcation point. It is observed that, in the region near the bifurcation point (see the shaded region), the maximum eccentricities reached under the quadrupole- and octupole-order Hamiltonian models have significant differences, while in the region far away from the bifurcation point they have no differences. This means that the octupole-order terms contribute significantly to the excitation of eccentricity in those regions near the bifurcation point.
Current usage metrics show cumulative count of Article Views (full-text article views including HTML views, PDF and ePub downloads, according to the available data) and Abstracts Views on Vision4Press platform.
Data correspond to usage on the plateform after 2015. The current usage metrics is available 48-96 hours after online publication and is updated daily on week days.
Initial download of the metrics may take a while.