Fig. 10
Download original image
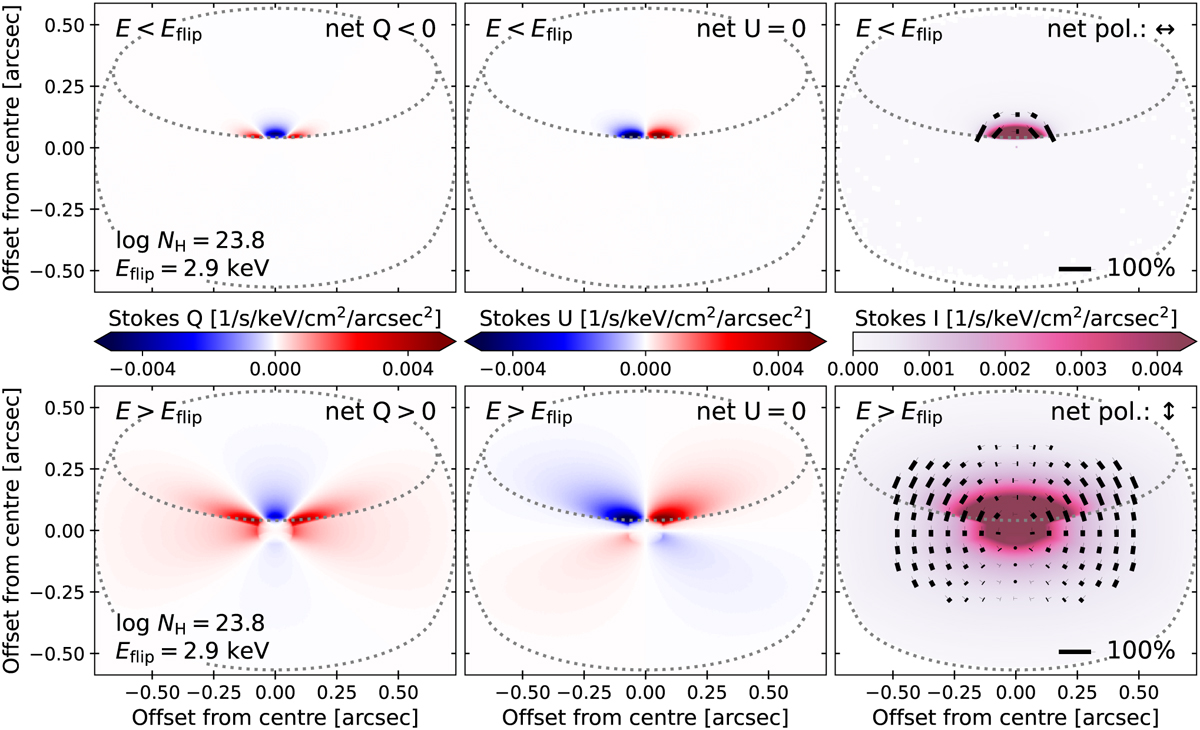
Spatially resolved Stokes surface brightness maps for the log NH = 23.8 torus model realisation shown in the top right panel of Fig. 9. The top (bottom) row corresponds to the energy band below (above) Eflip, where the net polarisation signal is perpendicular (parallel) to the torus symmetry axis. The total surface brightness (Stokes I, shown on the right) is overlaid with a linear polarisation map, visualising the polarisation degree (length of the map segments) and polarisation angle (orientation of the map segments). The dotted grey lines indicate the torus outlines.
Current usage metrics show cumulative count of Article Views (full-text article views including HTML views, PDF and ePub downloads, according to the available data) and Abstracts Views on Vision4Press platform.
Data correspond to usage on the plateform after 2015. The current usage metrics is available 48-96 hours after online publication and is updated daily on week days.
Initial download of the metrics may take a while.