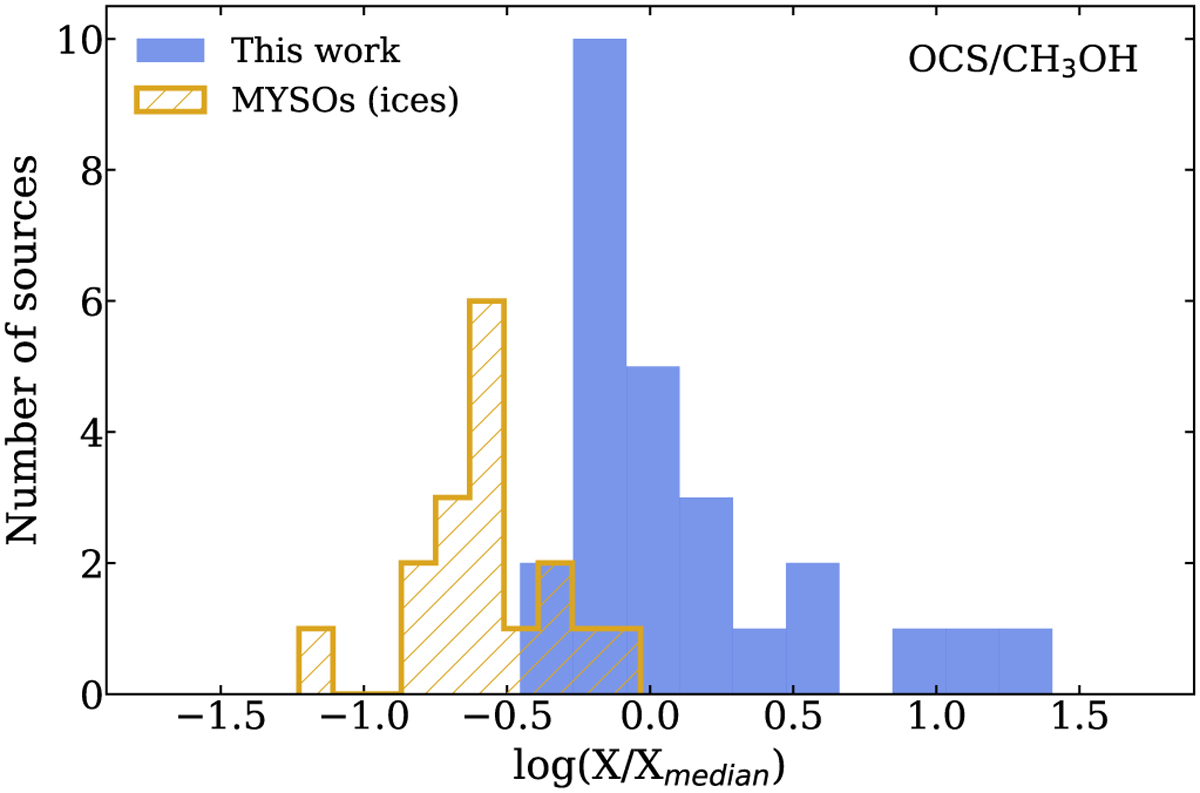
Fig. 5
Download original image
Relative abundance distributions of N(OCS)/N(CH3OH) for the gas-phase observations of massive sources analyzed in this work (blue) compared to ice observations toward 20 MYSOs (Boogert et al. 2022, yellow). Both histograms are normalized to the weighted gas-phase median value derived from the ALMAGAL dataset for 26 high-mass protostars.
Current usage metrics show cumulative count of Article Views (full-text article views including HTML views, PDF and ePub downloads, according to the available data) and Abstracts Views on Vision4Press platform.
Data correspond to usage on the plateform after 2015. The current usage metrics is available 48-96 hours after online publication and is updated daily on week days.
Initial download of the metrics may take a while.