Fig. 4

Download original image
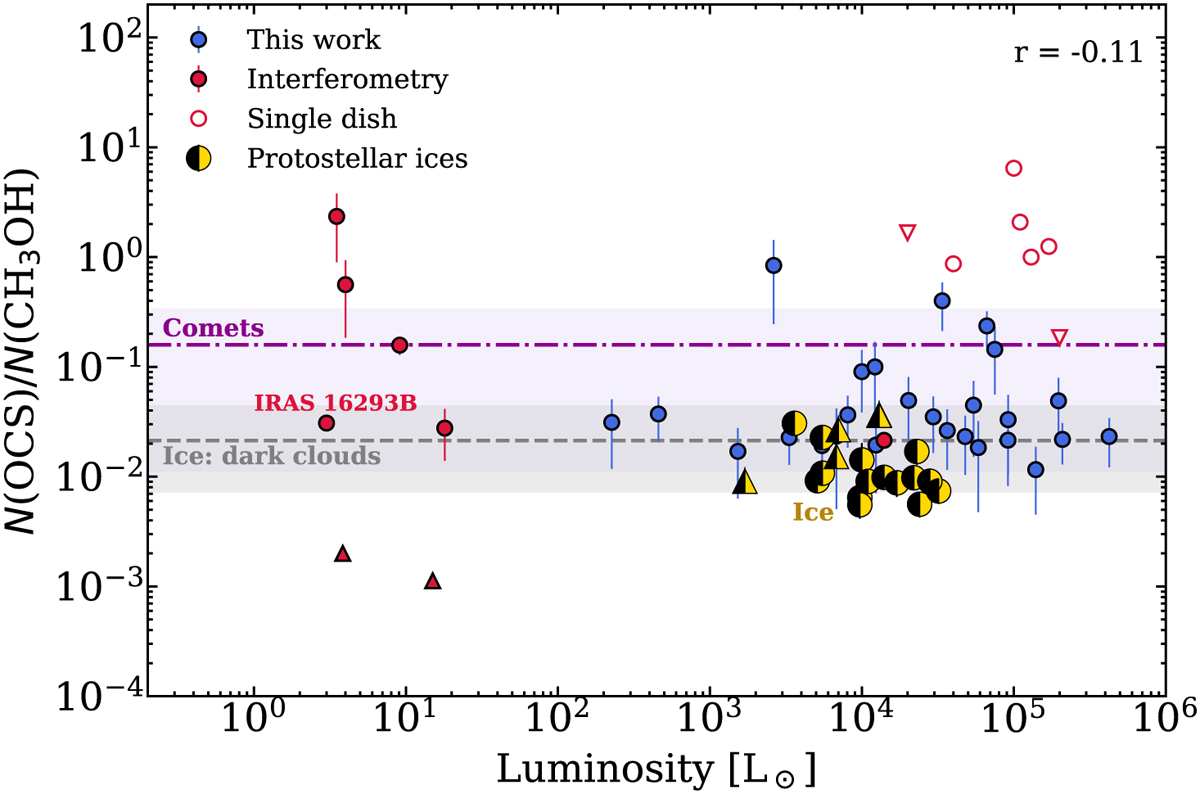
Column density ratios N(OCS)/N(CH3OH) derived in this work (blue markers) for 26 high-mass protostars as a function of luminosity. Literature gas-phase values are shown for comparison (red markers), together with ice values in protostars (yellow and black markers), dark clouds (dashed gray line), and comets (dash-dot purple line). The references can be found in Appendix I. Upper and lower limits toward protostars are denoted by downward and upward facing triangles, respectively. The ranges of values for dark clouds and comets are shown by their respective shadowed areas. For gas-phase ratios, filled markers correspond to interferometric observations, whereas empty markers denote single-dish counterparts. The Pearson correlation coefficient for protostellar ratios in both gas and ices, but excluding single-dish observations and lower limits, is displayed in the upper-right corner. IRAS 16293B stands for the source IRAS 16293-2422 B.
Current usage metrics show cumulative count of Article Views (full-text article views including HTML views, PDF and ePub downloads, according to the available data) and Abstracts Views on Vision4Press platform.
Data correspond to usage on the plateform after 2015. The current usage metrics is available 48-96 hours after online publication and is updated daily on week days.
Initial download of the metrics may take a while.


