Open Access
Fig. 2
Download original image
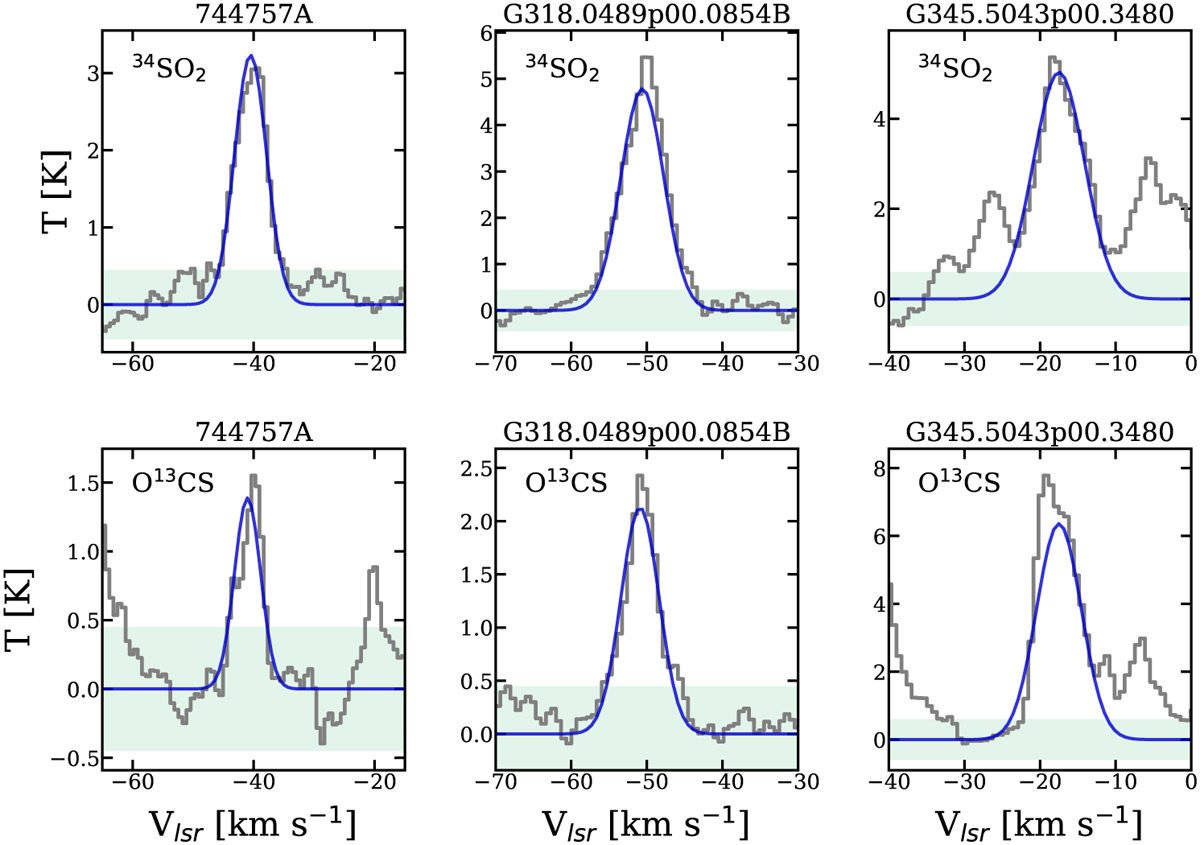
Observed spectra toward 744757A, G318.0489p00.0854B, and G345.5043p00.3480 (gray) superimposed by their best-fit models (blue). The upper panels show the lines of 34SO2 (111,11−100,10), and the lower panels lines of 013CS (18–17). The green shadowed area delimits the 3σ threshold.
Current usage metrics show cumulative count of Article Views (full-text article views including HTML views, PDF and ePub downloads, according to the available data) and Abstracts Views on Vision4Press platform.
Data correspond to usage on the plateform after 2015. The current usage metrics is available 48-96 hours after online publication and is updated daily on week days.
Initial download of the metrics may take a while.