Fig. E.1
Download original image
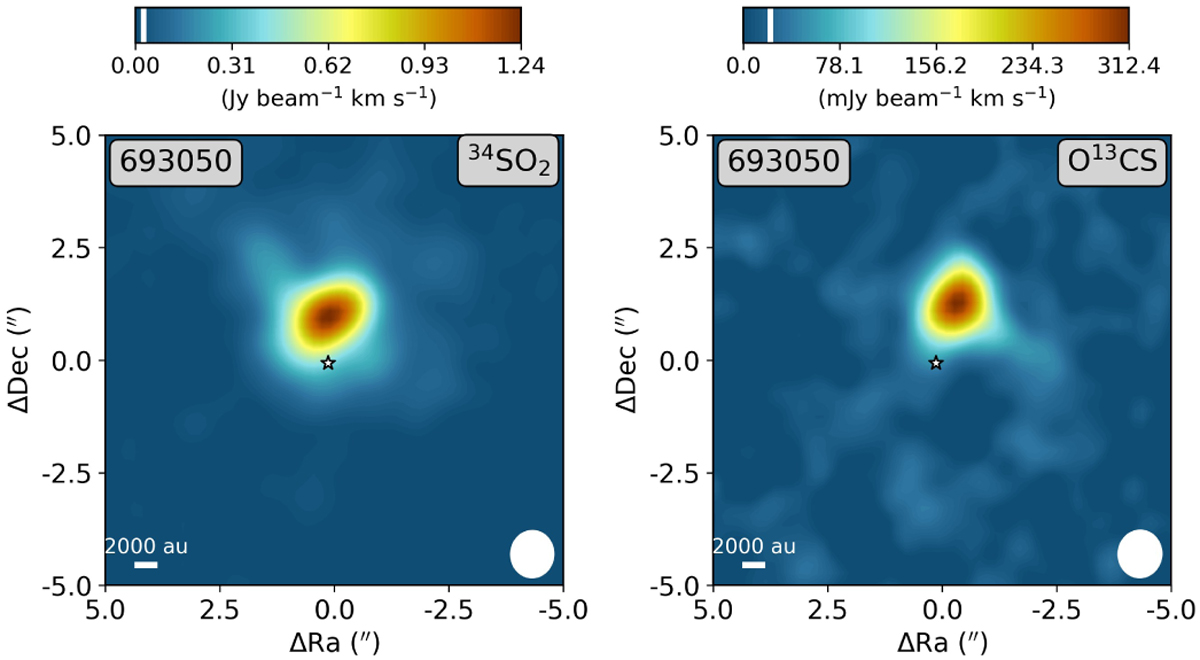
Integrated intensity maps of the 34SO2 111,11−100,10 (left) and O13CS 18–17 (right) lines for 693050. The integration limits are set to [-5, 5] km s−1 with respect to the source’s Vlsr. The white star denotes the source positions derived from the continuum emission, and the 3σ threshold is delimited by the white line in the color bars. The beam size is shown in the lower-right corner of each panel, and a scale bar is depicted in the lower left.
Current usage metrics show cumulative count of Article Views (full-text article views including HTML views, PDF and ePub downloads, according to the available data) and Abstracts Views on Vision4Press platform.
Data correspond to usage on the plateform after 2015. The current usage metrics is available 48-96 hours after online publication and is updated daily on week days.
Initial download of the metrics may take a while.