Fig. 6.
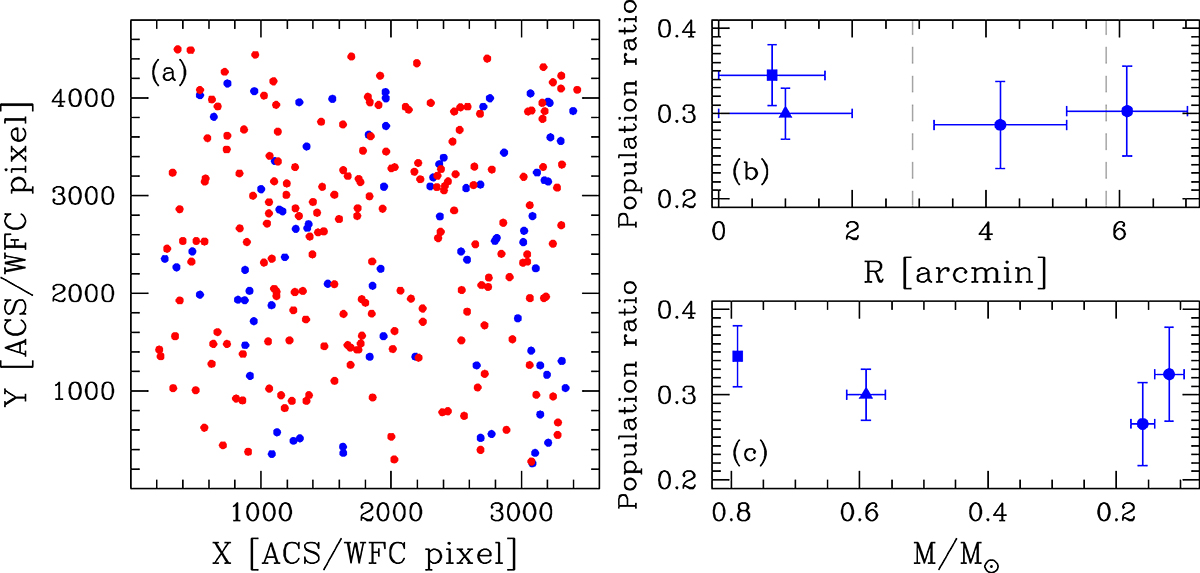
Download original image
Analysis of the radial an mass distribution of the two populations. Panel a: spatial distribution of the two populations in the X − Y plane. Points are colour-coded as in panel g of Fig. 2. Panel b: fraction of MSa stars as a function of radial distance from the centre of the cluster, R. The values obtained in this work are represented with circles, while the estimates from Milone et al. (2012a, 2017) are shown with triangles and squares, respectively. Each dataset corresponds to different mass ranges (see panel c). The grey dashed lines are set at rh and 2 rh. Panel c: fraction of MSa stars as a function of stellar mass. Symbols have the same meaning as in panel b.
Current usage metrics show cumulative count of Article Views (full-text article views including HTML views, PDF and ePub downloads, according to the available data) and Abstracts Views on Vision4Press platform.
Data correspond to usage on the plateform after 2015. The current usage metrics is available 48-96 hours after online publication and is updated daily on week days.
Initial download of the metrics may take a while.