Fig. 5.
Download original image
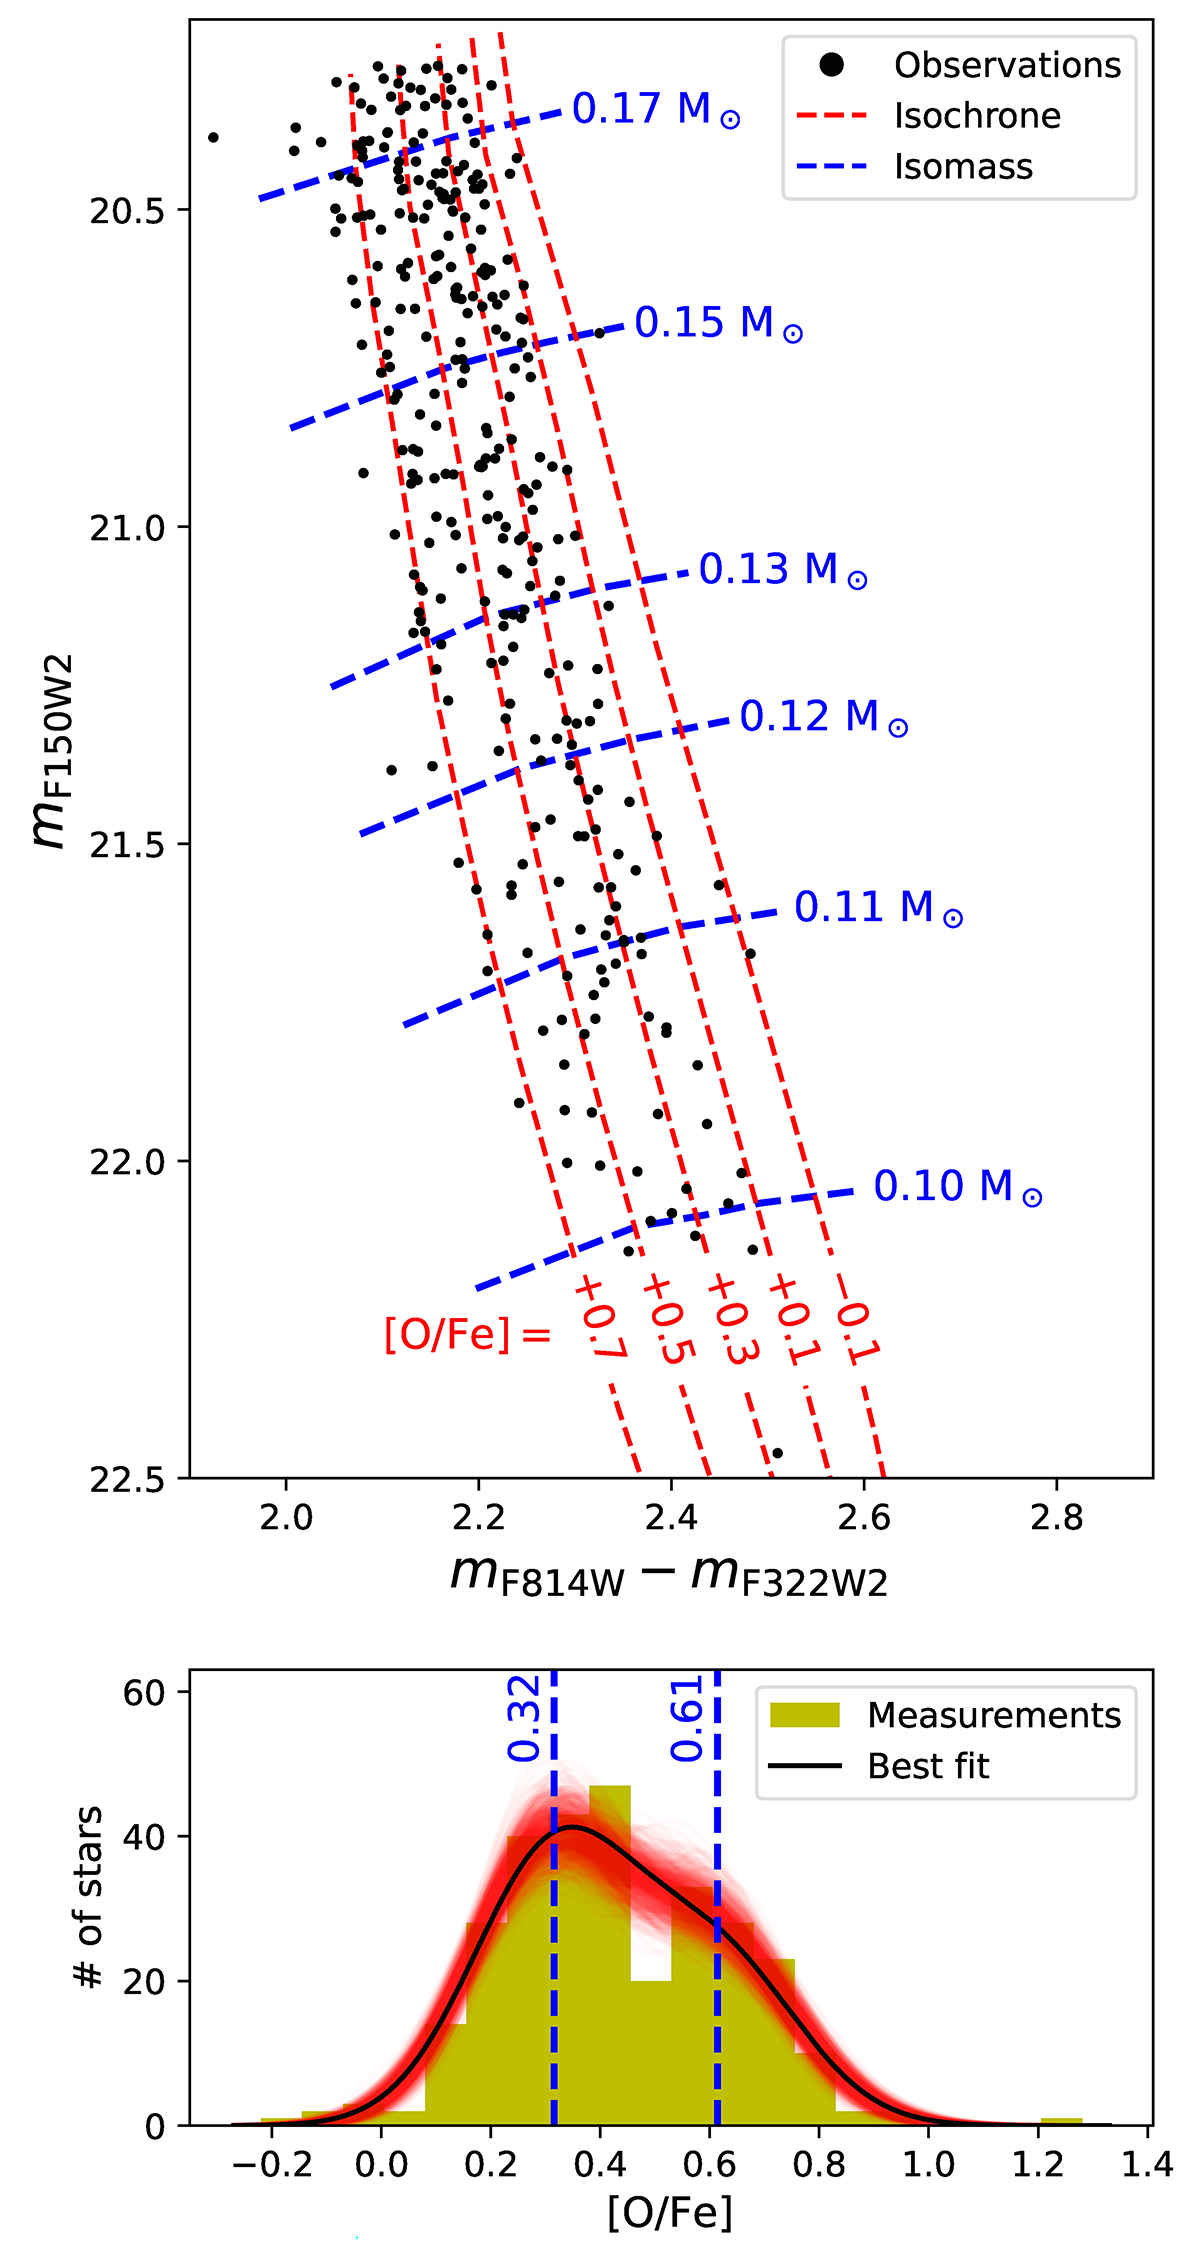
Isochrone fit and chemical study of the two populations. Top: model isochrones calculated in this study overplotted on NIRCam photometry of NGC 6397. The isochrones are labelled by the adopted oxygen abundance. Linearly interpolated isomass lines are shown for selected masses. Bottom: histogram of measured [O/Fe] values for the individual stars in the cluster. The best-fit two-component Gaussian mixture is overplotted, with the central values of both components indicated with vertical lines. The uncertainty in the best-fit distribution was estimated using 1000 bootstrap trials, shown with semi-transparent red lines.
Current usage metrics show cumulative count of Article Views (full-text article views including HTML views, PDF and ePub downloads, according to the available data) and Abstracts Views on Vision4Press platform.
Data correspond to usage on the plateform after 2015. The current usage metrics is available 48-96 hours after online publication and is updated daily on week days.
Initial download of the metrics may take a while.