Fig. 4.
Download original image
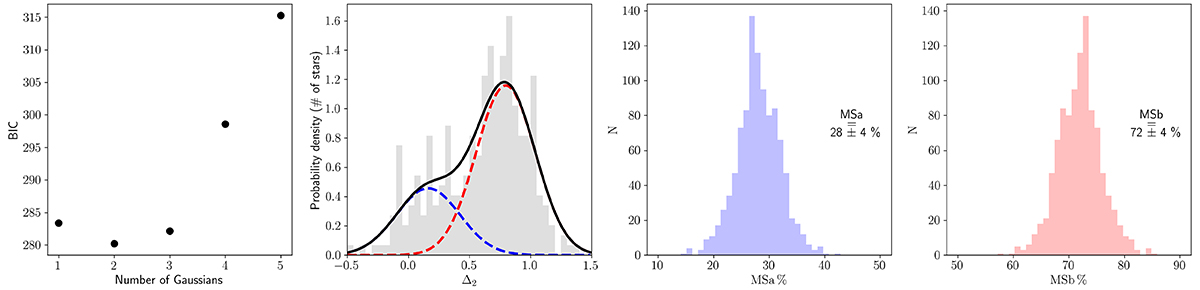
Analysis of the Δ2 distribution using GMM. First panel: BIC as a function of the number of Gaussian components considered in the GMM. Second panel: histogram of the Δ2 distribution fitted with a two-Gaussian model (black continuous line). The two components of the two-Gaussian model are plotted as blue and red dashed lines. Third and fourth panels: distribution of the ratio of the two populations obtained from 1000 repetitions of the GMM fitting process. The reported values represent the median and standard deviation of the distribution.
Current usage metrics show cumulative count of Article Views (full-text article views including HTML views, PDF and ePub downloads, according to the available data) and Abstracts Views on Vision4Press platform.
Data correspond to usage on the plateform after 2015. The current usage metrics is available 48-96 hours after online publication and is updated daily on week days.
Initial download of the metrics may take a while.