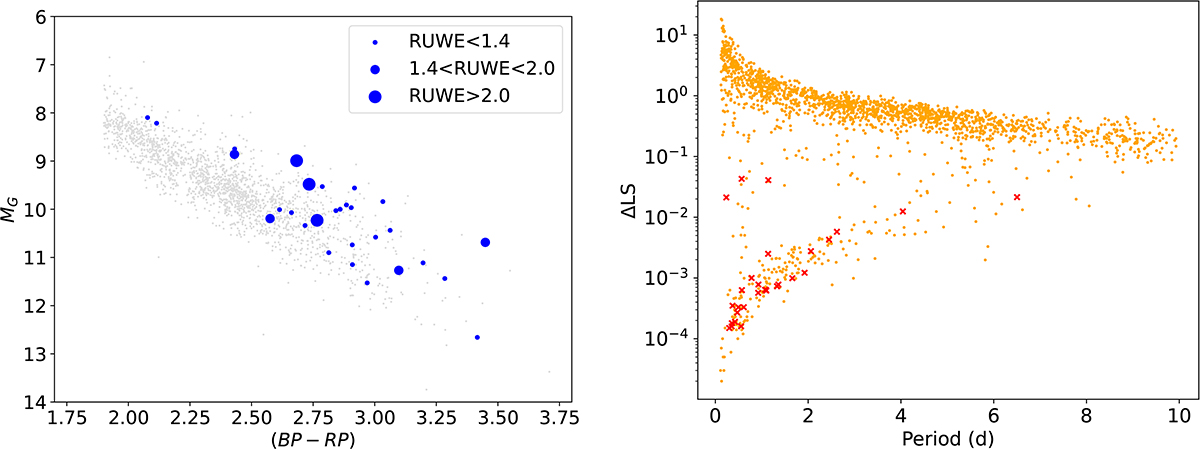
Fig. 4.
Download original image
Gaia HRD (BP − RP, MG) of low mass stars (grey) with those identified as showing significant variability of the rotational amplitude over time shown as circles whose size indicates their Gaia RUWE value (see text for details) on the left. The low mass star sample (orange dots) is on the right-hand panel, with the 29 stars which were identified as having a rotational amplitude which varies significantly over time shown as a red × symbol.
Current usage metrics show cumulative count of Article Views (full-text article views including HTML views, PDF and ePub downloads, according to the available data) and Abstracts Views on Vision4Press platform.
Data correspond to usage on the plateform after 2015. The current usage metrics is available 48-96 hours after online publication and is updated daily on week days.
Initial download of the metrics may take a while.