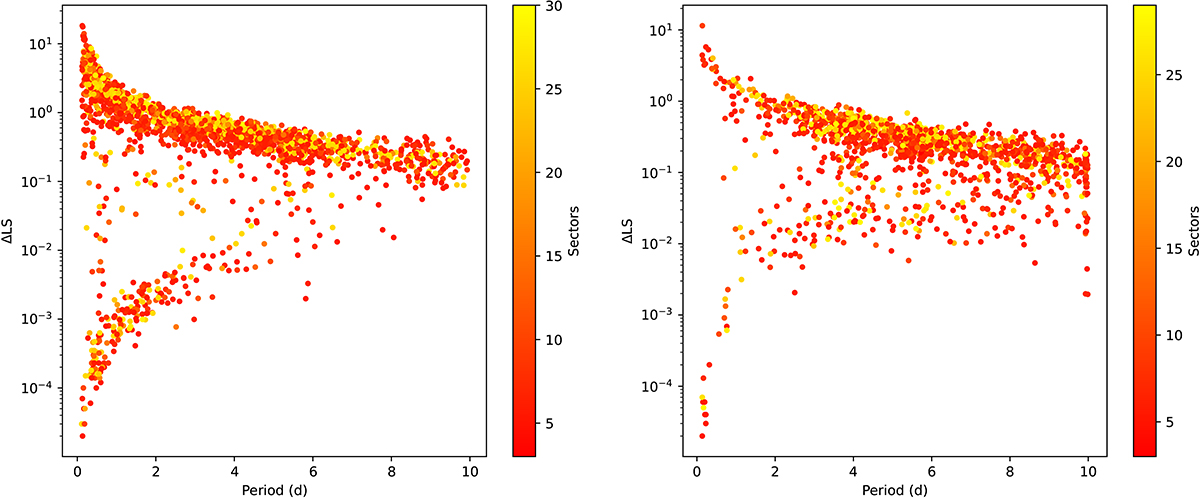
Fig. 2.
Download original image
Median period from their individual light curves and calculated ΔLS For all the 1950 M dwarf stars in the sample (left). Higher values of ΔLS indicate a greater spread in the values of the period over the sectors in which they were determined. The colours of the points indicate how many sectors of data were analysed. The same distribution but for the 1432 stars in our solar-like sample is shown on the right.
Current usage metrics show cumulative count of Article Views (full-text article views including HTML views, PDF and ePub downloads, according to the available data) and Abstracts Views on Vision4Press platform.
Data correspond to usage on the plateform after 2015. The current usage metrics is available 48-96 hours after online publication and is updated daily on week days.
Initial download of the metrics may take a while.