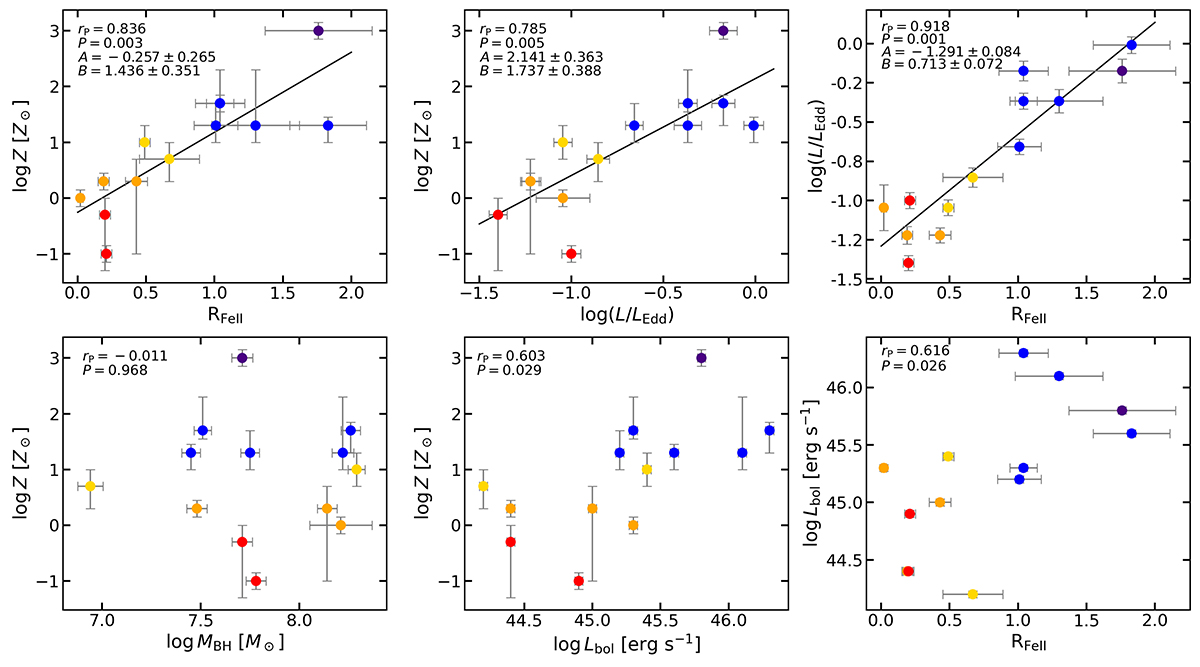
Fig. 9.
Download original image
Figures showing a correlation between various accretion parameters with log Z and RFeII. Points are displayed using the same color-coding as in Figure 4, with their error bars. When the correlation is considered significant (rP ≳ 0.7, corresponding to a confidence level of ≈0.01), the correlation line is shown, with its defining parameters intercept (A) and slope (B) shown with their respective errors. For each correlation are also shown the Pearson correlation coefficient, rP, from the SLOPES program (Feigelson & Babu 1992) and the probability, P, of a spurious correlation.
Current usage metrics show cumulative count of Article Views (full-text article views including HTML views, PDF and ePub downloads, according to the available data) and Abstracts Views on Vision4Press platform.
Data correspond to usage on the plateform after 2015. The current usage metrics is available 48-96 hours after online publication and is updated daily on week days.
Initial download of the metrics may take a while.