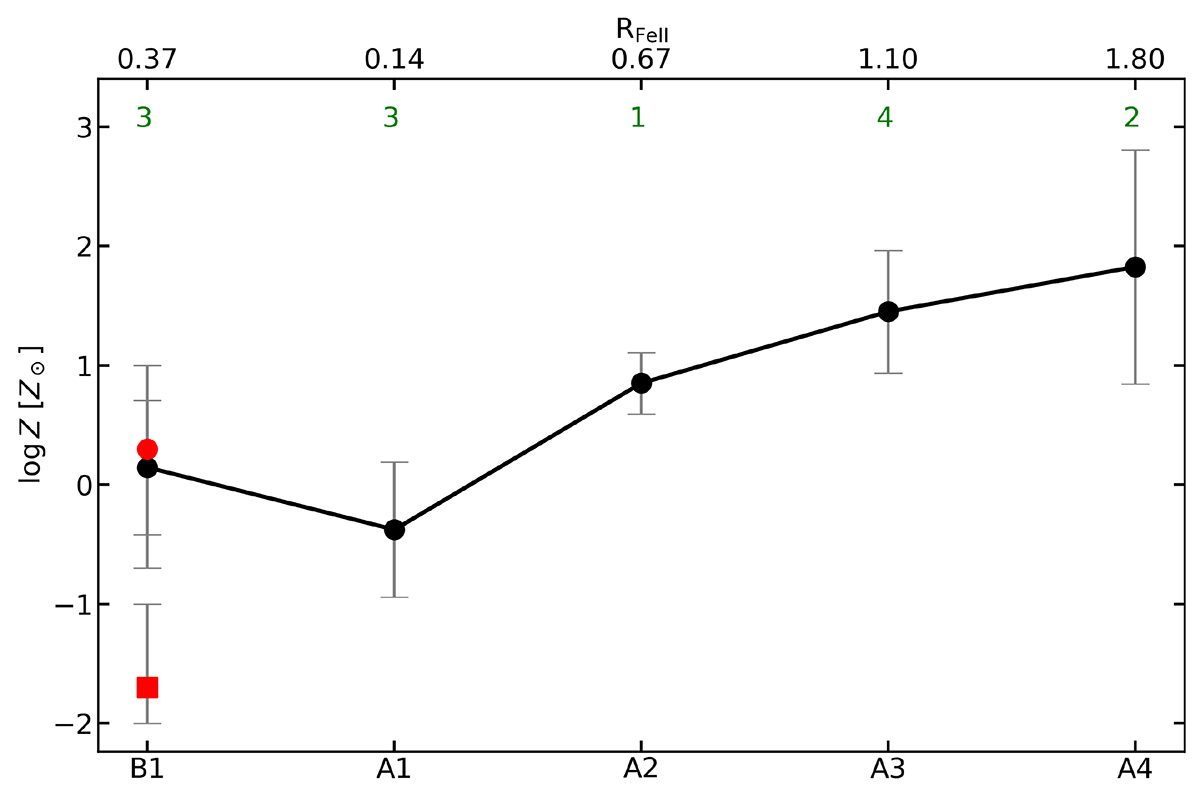
Fig. 8.
Download original image
Diagram illustrating the trend of Z across different spectral types, with the reference values for each spectral type obtained as the geometric mean of all the measurements assumed for all the objects belonging to a specific spectral type, including our method, the use of the CIV/Hβ ratio, and the presence of microturbulence for all sources belonging to the A2, A3, and A4 spectral types. Confidence intervals are obtained as the standard deviation of our results. The number of objects contributing to each spectral type is shown in green, along with the average RFeII of the sources considered. Two reference points (in red) are shown describing the RL and RQ Pop. B sources studied in M23.
Current usage metrics show cumulative count of Article Views (full-text article views including HTML views, PDF and ePub downloads, according to the available data) and Abstracts Views on Vision4Press platform.
Data correspond to usage on the plateform after 2015. The current usage metrics is available 48-96 hours after online publication and is updated daily on week days.
Initial download of the metrics may take a while.