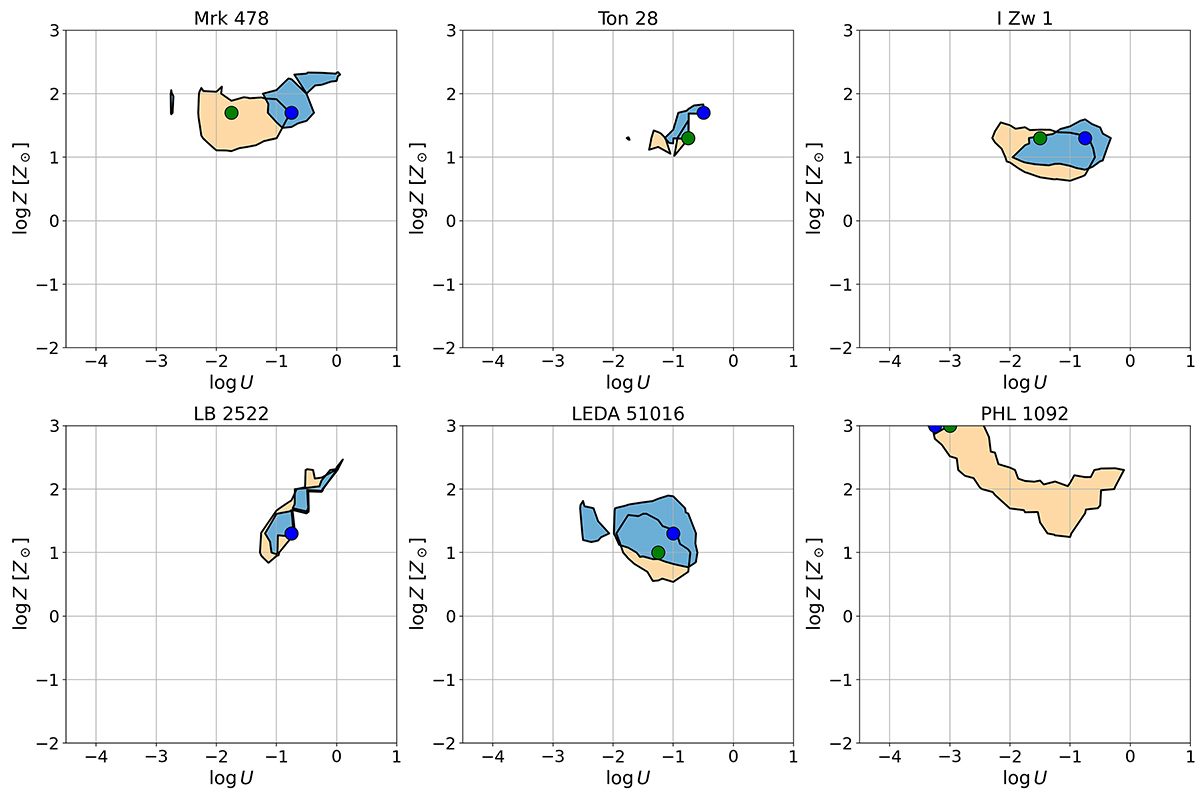
Fig. 6.
Download original image
Two-dimensional parameter space of log Z − log U illustrating the physical conditions of the gas surrounding xA sources with different SEDs. In each plot, the minimum χ2 computed between measured diagnostic ratios and CLOUDY simulations is shown with dots: green for the Mathews & Ferland (1987) SED and blue for the xA SED. The orange region corresponds to the 1σ accuracy range for the Mathews & Ferland (1987) SED, and the blue region for the xA SED.
Current usage metrics show cumulative count of Article Views (full-text article views including HTML views, PDF and ePub downloads, according to the available data) and Abstracts Views on Vision4Press platform.
Data correspond to usage on the plateform after 2015. The current usage metrics is available 48-96 hours after online publication and is updated daily on week days.
Initial download of the metrics may take a while.